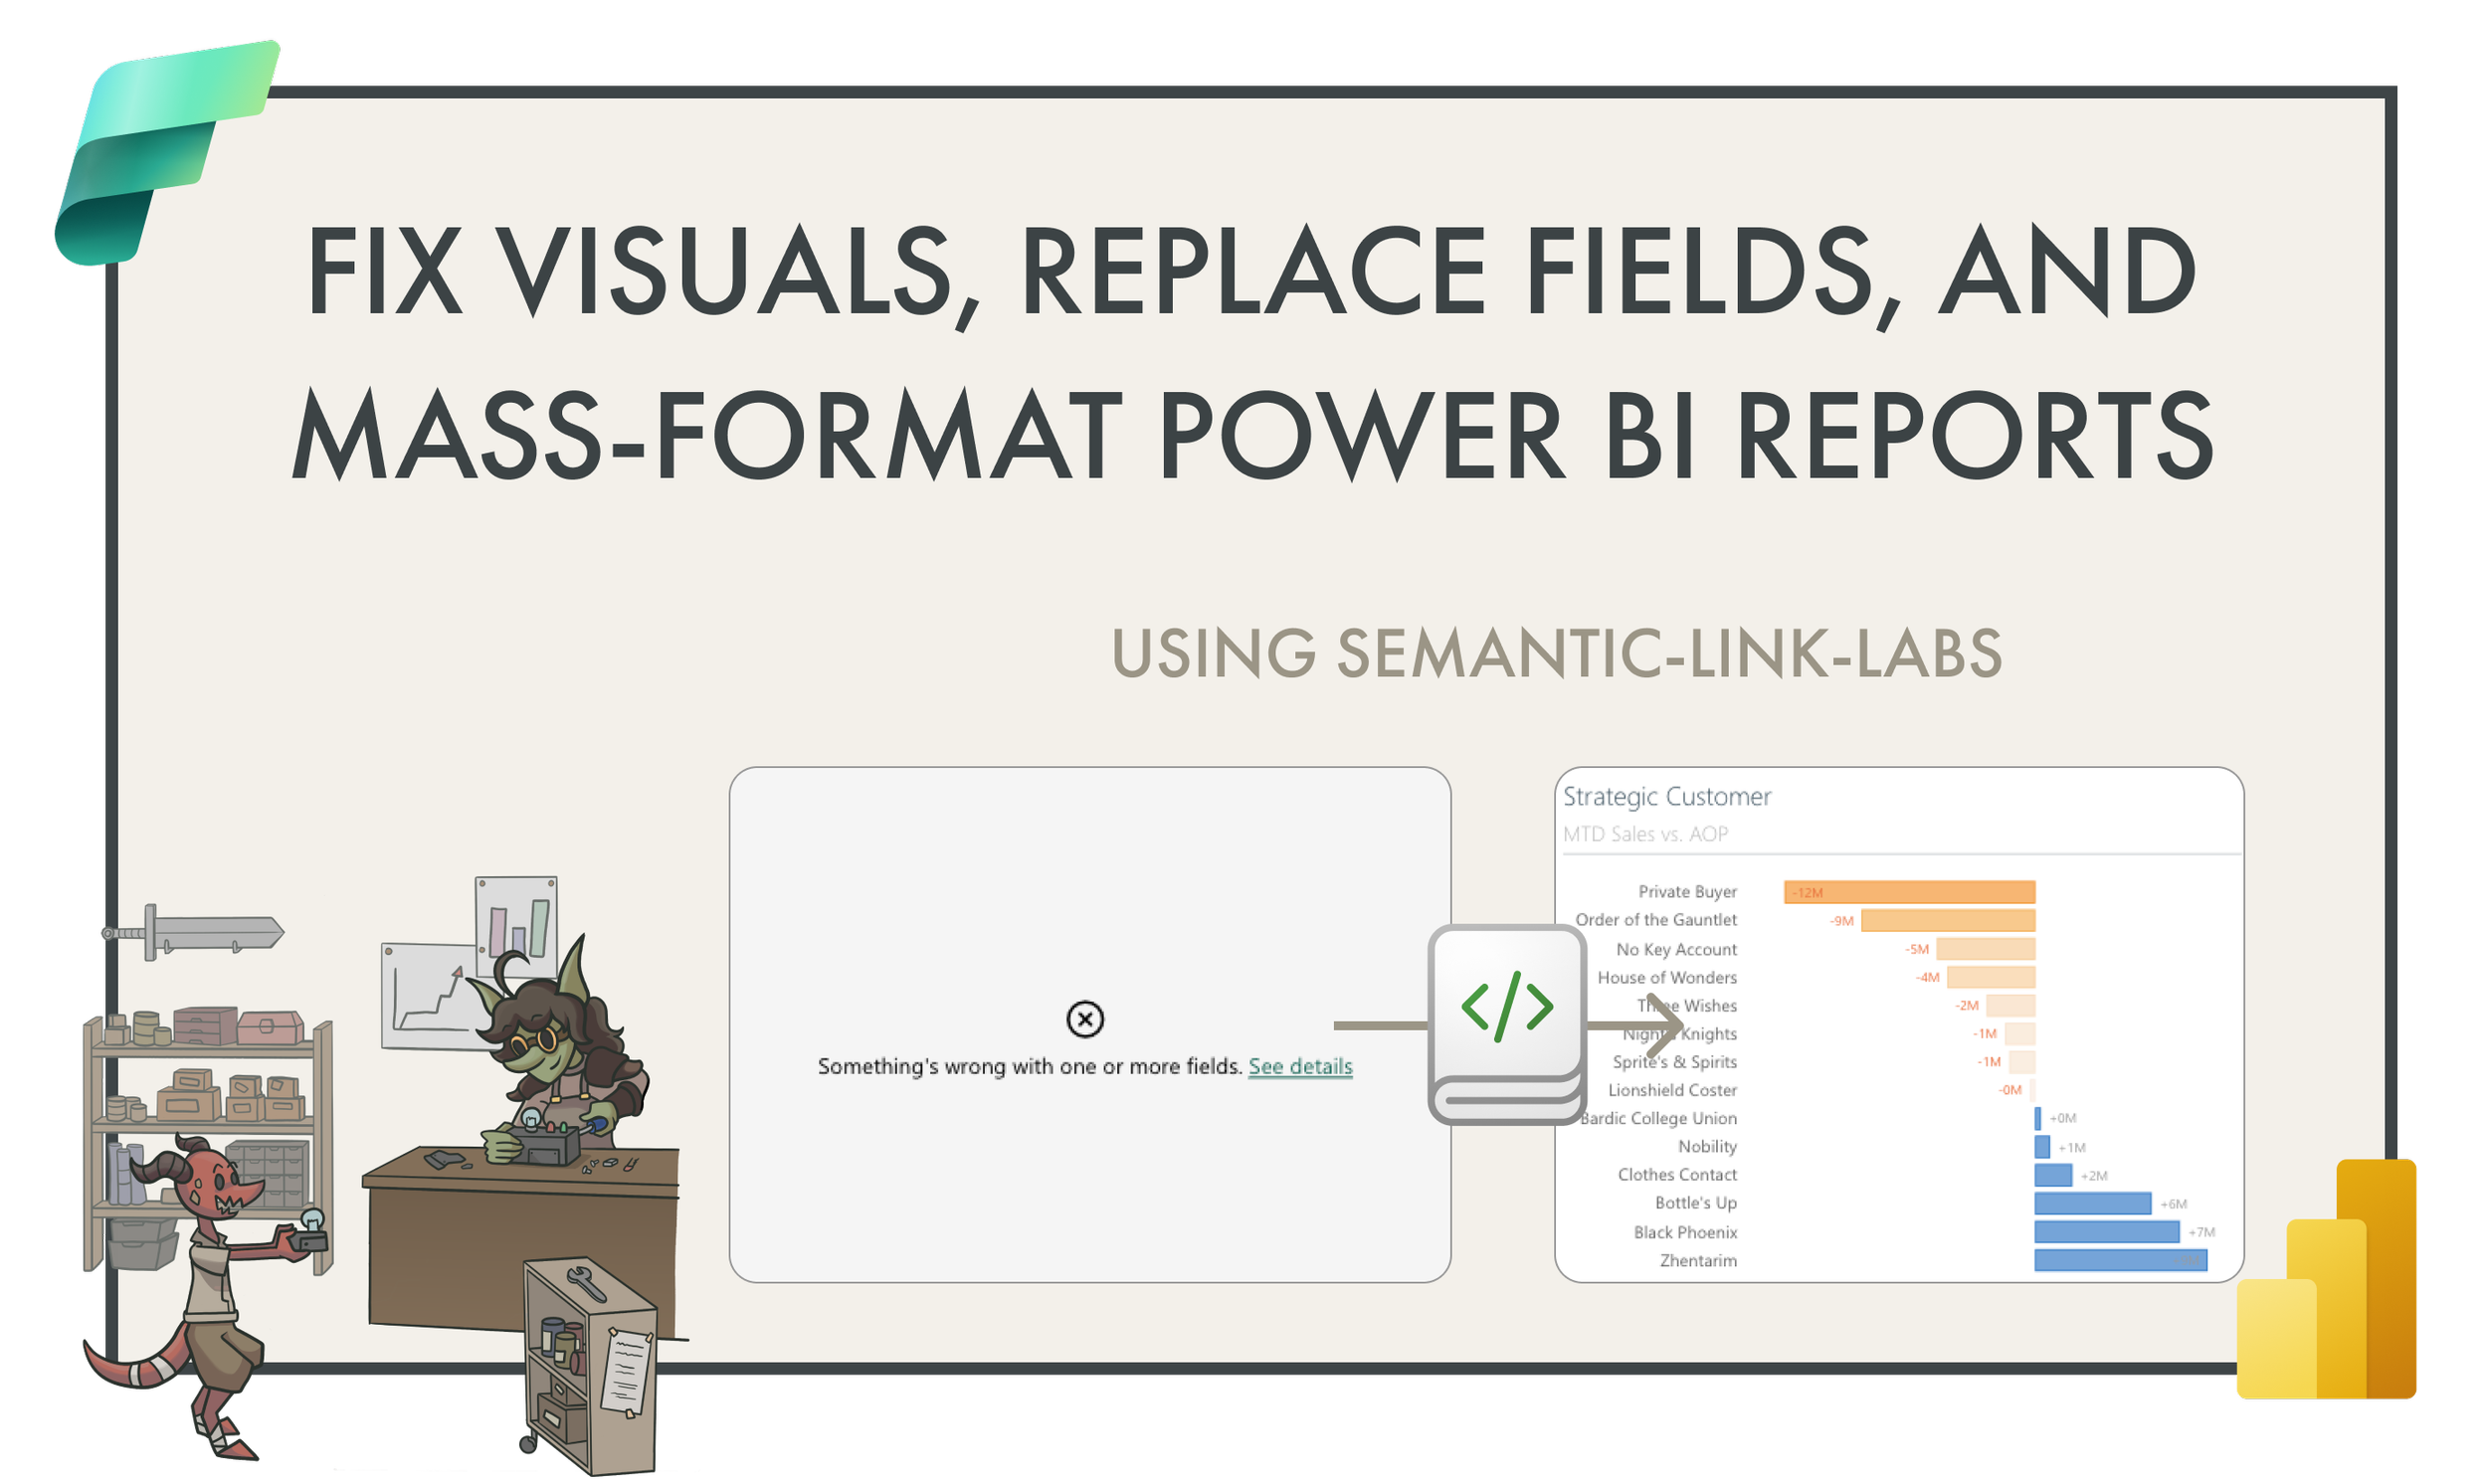
Fix visuals, replace fields, and mass-format reports in Power BI
VIEW, COPY, AND MODIFY POWER BI REPORTS IN NOTEBOOKS
…by using semantic-link-labs in a Fabric notebook to programmatically work with reports.
TL;DR: Use semantic-link-labs in a Fabric notebook to get the report.json and modify it, then publish a new report with the updated JSON.

Whether building reports in Power BI Desktop or in the web browser via the Power BI service, you have limited options to batch or streamline changes. Put another way; it’s tedious and slow to make many small changes to one or more Power BI reports. It’s also easy to make mistakes
When initially designing or building a report, this is not so much of a problem. Unless you’re using a template, you want to control report layout and formatting, yourself. However, certain changes can be little more than a waste of time. Some examples include:
Replacing fields when there’s a broken reference due to i.e. renaming a model measure or column.
Swapping one measure or column for another in the report
Changing visual container styles, like background, border, and shadow/glow.
Changing text or text styles across multiple visuals, pages, or reports.
Changing chart formatting (like color) or properties (like edit interactions) across multiple visuals, pages, or reports.

Doing these and similar repetitious changes can take copious amounts of time. Around 4-5 years ago, I’d once seen a junior Power BI consultant spend over a week on tasks like this alone during a report migration. I don’t doubt that there are many people who experience something similar, today. However, seeing this prompted me to find a different way to streamline these tasks and not waste so much time… and it’s how I first became interested in Power BI report metadata, and the Layout JSON file contained within Power BI Desktop (PBIX) files. In the past, I’ve documented various ways to manipulate this report metadata to streamline these changes.
Now, thanks to semantic-link-labs in Fabric notebooks, this process is even easier, and doable with any published report. While writing changes to the report.json of a Power BI report is still technically unsupported, the new Power BI enhanced report (PBIR) format will support these changes. Michael Kovalsky, the main author of the semantic-link-labs library, has also already come out with a report package that contains many useful functions to help manage and modify Power BI reports using the PBIR format, programmatically.
In future articles and videos, I’ll give an overview of some of these methods. However, since they’re limited to PBIR formats—which in preview still have extensive limitations and aren’t recommended for production use—this article will cover how you modify reports that don’t use the PBIR format.
 The purpose of this article is twofold:
1. To explain how to view, copy, and make changes to a Power BI report from a Fabric notebook.
2. To demonstrate a use-case for semantic link labs in Fabric notebooks with Power BI reports.
This article is informative; I'm not trying to sell you Fabric, nor endorsing a tool, feature, or approach.
This article is one of three examples of things I like to do in semantic-link-labs with reports.

WALKING THROUGH AN EXAMPLE
In this example, we need to make some changes to a report. Specifically, we need to change some text and colors across all pages and visuals. Doing this manually would take a long time, so we’ll streamline it using semantic-link-labs.
Note that to use semantic-link-labs in a notebook, you need to have access to a Fabric workspace. However, the target reports that you manage with semantic-link-labs do not need to be in a Fabric workspace. Furthermore, you should also install semantic-link-labs in the notebook (by running the code %pip install semantic-link-labs before you import the sempy_labs library) or set up a custom environment (which is the preferred approach).
VIEWING A REPORT IN A NOTEBOOK
Before we start with the report, we’ve been asked to re-name the “Key Account” field in the upstream semantic model to “Strategic Customer”. Since this model is in a Fabric workspace, we can connect to it via XMLA endpoint to view and manage it with Tabular Editor. Note that we could also use Power BI Desktop and republish the model, or write this as code in the notebook by using the TOM package of semantic-link-labs.
In a few seconds, we re-name the field and save those changes to the model. We can then open the notebook and get ready to make our changes. A good thing to do before making our changes is to view the report in its “before” state. We can easily do this in the notebook itself using the semantic-link-labs launch_report function. This renders the report in the notebook cell output. You can see an example of this below:
The report being viewed in the notebook. Note the broken visual in the top-right, which is highlighted yellow.
As you can see, the report renders, but we also have a broken visual with the grey box of death. When clicking the error for more information, we understand that the visual is unable to render because it’s referring to the “Key Account” field, which we just renamed to “Strategic Customer”.
The visual is showing a “grey box of death” because the field reference is broken; it’s referring to a field “Key Account” that doesn’t exist in the model, because we re-named it to “Strategic Customer”.
When you re-name fields in a Power BI model, visuals in connected reports don’t update to reflect these field name changes, automatically. Instead, you have to manually change these broken references, yourself. This can be a huge pain in the ass, especially if the fields involved are used in conditional formatting options, which can be hidden behind 3-4 sub-menus in the click tax-heavy formatting pane.
Instead, let’s just fix these broken visuals automatically as part of our mass formatting changes. We’ll start in the next step, by retrieving the report.json; the metadata for the report layout.
RETRIEVING AND MODIFYING THE REPORT.JSON
In semantic-link-labs, there’s a simple function that you can use to get the report.json of a Power BI report. This returns the report.json as a dictionary, which you can use in later, downstream steps. For most Power BI reports, this file is a heavily nested and escaped JSON containing many abstract properties that describe the report layout and configuration.
Any reports that are using the new, preview PBIR format, however, will have the JSON in that format, which is simpler and easier to read, but also serialises the report metadata into multiple files. Serialising the metadata basically just means that you get separate files for different parts of a report, like a separate file for each visual, for instance. The reason for this is because it improves source control with features like Git integration together with Azure Repos or GitHub. If you don’t know what that is; don’t worry about it, for now.
You can see an example of how we get this code and an excerpt of the resulting report.json below:
Note the report.json is heavily nested and difficult to read. it isn’t formatted, but even formatting it in a code editor like VS Code doesn’t make it more understandable. If you understand this JSON and have it documented, you can make specific modifications, removals, or additions; however, for most, this isn’t possible.
The new PBIR format will make this much more achievable.
Once we have the report.json we can modify it. For instance, we could do a find/replace over the entire report.json file, or navigate the dictionary structure to remove, add, or replace certain things.
In the current report.json structure, however, the latter option is very challenging. This is because—as previously mentioned—the report.json file is heavily nested, not publicly documented, and contains many oddities that make working with it problematic. This is also why PBIR will be easier and better in the future, but it’s unclear how soon or far away this is.
For this example, we’ll proceed with the simplest scenario, where we do a mass find/replace across the entire report.json. This is suitable for our scenario, where we want to make changes across all report visuals and pages. However, if you wanted to make changes to a subset of visuals or only certain pages, this would not be appropriate. Using this approach, you also need to be careful that you don’t accidentally replace a substring in an unintended part of the report.json, as this can lead to undesired changes or making the report.json unusable.
To make these changes, we run the code from the following cell:
Making a mass find/replace across the entire report.json. We’re making four different changes; one change to the field reference, two formatting changes, and one change to the report title text. As mentioned, unless you’re using the dict to refer to specific keys in the report.json, you might make unintended changes with this approach.
This simple example is intended to demonstrate the technique and the easiest scenario.
This code will make several replacements:
We will replace the “Key Account” column with “Strategic Customer”, which should fix all broken visuals.
We will replace two colors (orange and grey) with two different colors (yellow and blue).
We will modify the report title
CREATING REPORTS FROM AN EXISTING REPORT.JSON
Finally, we’re going to use the report.json to create a new report (instead of updating the existing report, which is dangerous until we validate our changes). Again, this is straightforward in semantic-link-labs using a function to create the report from the report.json. Notably, we have to specify the name of the semantic model that we want the report to connect to, as well.
You can see an example of this, below:
Creating the report from the modified report.json
Once we have successfully created the report, we can view it in the notebook and validate that the changes are made:
The resulting report has fixed the visual and applied the formatting changes.
As you can see in the above example, the report is updated, the visuals are fixed, and everyone is happy.
 There are several scenarios where this doesn't work:
From my testing, this does not work if your target report has a background image or uses images that you've uploaded from the Power BI Desktop user interface. These images are part of the report definition RegisteredResources, and are separate files that need to be packaged with the report.json in the new report.
COPY AND REBIND THE REPORT
From here, we might want do things like copy the report to a new workspace or rebind it to another semantic model (change its data source). Both of these used to be tedious tasks with published reports, which required either fandangling with the REST APIs or working manually in Power BI Desktop and re-publishing. Now they are just a few lines of Python code in the notebook.

TO CONCLUDE
When building Power BI reports, there are many ways that you can (inadvertently) waste a lot of time. One common way is with repetitious or monotonous tasks, like when you need to make changes to many visuals, pages, or reports. To streamline this, you can modify the report.json. While this is not officially supported, you can still do this easily in a PBIP file on your local machine or in a Fabric notebook using semantic-link-labs.
In the future, the possibilities to programmatically modify reports and enhance your productivity will only increase with the PBIR format and continued momentum and improvements to semantic-link-labs.