Fix Visuals or Replace Measures in Power BI Reports using pbi-tools

REPLACE MEASURES WITHOUT RE-DOING FORMATTING
…and prevent reports ‘breaking’ when you move measures to other tables in Power BI
CONTEXT - THE PROBLEM

Renaming fields (even measures) or moving measures to another table breaks visuals. We can fix this.
GREY BOXES OF DEATH

The infamous “grey box of death”
Renaming measures or moving them to another table will break any visuals using them in reports. When using a field in a report visual, Power BI identifies the field not by a unique identifier, but by the name. So if you rename the measure, the visual will not work anymore. Instead, you will find a “grey box of death”. Normally, the only way to fix this is to go in the report and replace the “broken” measure reference in the visual with the re-named measure. What’s worse is you need to redo any formatting that was applied to the values. This costs a lot of time, and means you must avoid re-naming or moving measures once report development has started.

Broken measure ref.
A similar case is when a report needs to change many visuals, swapping out one measure for another, for example if you want to recycle a view or if stakeholder requirements have changed late in the design process. You could modify the underlying measure’s DAX expression, keeping the name intact, but that’s not always the best solution, particularly when the model is used for self-service or personalize visuals is enabled. It would be better if there was a way to replace all or multiple measures in Power BI report visuals, swapping the existing measures out for others while keeping the formatting. Instead - both in this case and the prior - the developer has to go through each visual, one-by-one, changing the visuals and re-applying formatting.
Dealing with these cases in Power BI Desktop can be a tremendous waste of time; it’s really frustrating, and there’s sometimes no way around it.
At least I used to think that there was no way around it, because actually… there is. And even with its simplest implementation, it’s already saved me a lot of time & headaches.

When you open a report and see grey boxes of death, everywhere…
PBI-TOOLS TO THE RESCUE
Using pbi-tools, you can programmatically fix the broken measure reference in the report(s).
You can even use this method to hot-swap measures or fields in visuals, retaining the formatting.
pbi-tools is an external tool that decompiles .pbix files using the .zip method. If you do this, you can see the ‘Reports/Layout’ definition; effectively, the source code for the report. If we look into this information, we can see why re-naming measures breaks the visuals.
Note that this doesn’t work if the .pbix file is encrypted, for example using sensitivity labels.
WHY IT BREAKS: THE VISUAL REFERS TO THE FIELD & TABLE NAME
Inside of the Layouts definition of the visual, we can see that for both columns and measures, there is an explicit reference to both the table and the field name. This doesn’t necessarily make sense, particularly if we understand that in DAX a table reference is not needed for a measure, only for a column. It also explains why both re-naming the measure and moving it to a table will break the visual, even though the underlying DAX expression would still execute, fine.
Interestingly, this logic is somehow reflected in the syntax, where the Visual Layout refers to the fields in several different base keys. There are 3 different ways that fields are referenced:
Full fields: TableName.ColumnName or TableName.MeasureName
The TableName prefix forms when the field is first used, but it’s not updated or used for measures.
Example below from config.json: “queryRef” or “Name” keysTables: TableName only
This is used, even for measures
Example below from config.json: “Entity” keyFields: FieldName or MeasureName only
This is used
Example below from config.json: “Property” key

Yellow = Table Name in I.E. ‘queryRef’ or ‘Name’ keys - not used for measures; automatic syntax
Pink = Field Name (i.e. Column, Measure) in ‘queryRef’, ‘Name’ or ‘Property’ keys - always used
Teal = Table Name in ‘Entity’ keys - always used
This is a small example from a ‘card’ visual ‘config.json’ file. There are also other keys used depending on the visual and properties; wherever the field is referenced, such as in (conditional) formatting. Complex visuals will have a lot more references across multiple .json files. In the next step, you need to be careful when handling visuals with a lot of formatting, that you replace all the necessary references, and don’t mistakenly change something that should have remained static.
FIXING THE VISUALS: REPLACING THE REFERENCES
So the visuals are broken because the references don’t correspond to an actual object in the model. Fixing it is easy - you replace the “incorrect” name with the “correct” one. Remember, for measures, we don’t have to worry about the ‘TableName’ prefix for values = TableName.MeasureName. But we do have to change standalone ‘TableName’ references, i.e. for the “Entity” key.
This means that we can programmatically fix broken visuals due to model changes; we don’t have to go into the ‘thin’ report and manually adjust the fields in order to fix these “grey boxes of death”. We can even use this approach to swap fields altogether for others that are in our model; its as simple as a find & replace. Once we have handled the reference and corrected it, we just need to recompile our .pbix with pbi-tools compile, and it works!
The only complexity comes if we desire specificity - i.e. replacing in just one page, or when there are redundancies in naming. An example of naming redundancy would be if we move the [Sales] measure from the ‘Revenue’ table to a ‘_Measures’ table. If we replace ‘Revenue’ in the layout JSON indiscriminately, chances are we will affect something unintentionally. To ensure we don’t do this, we should use regex or the appropriate key/value pairs to add specificity to the string find/replace, but this is not the scope of this particular article, which is intended as an introduction to the approach.
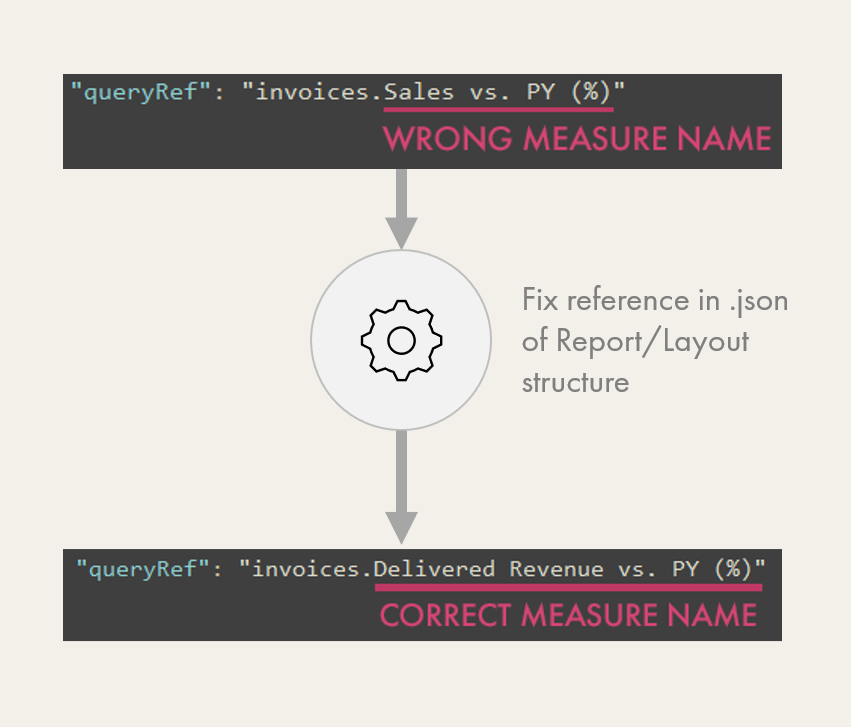
EXAMPLE: FIXING AFTER RENAMING MEASURES
I changed the measure name from [Sales vs. PY (%)] to [Delivered Revenue vs. PY (%)]
I fixed it by decompiling the report, handling the reference in the .json, then recompiling it.
EXAMPLE: FIXING AFTER MOVING MEASURE TO ANOTHER TABLE
I changed the [Orders vs. PY (%)] measure from the Orders to the Customers table
I fixed it by decompiling the report, handling the reference in the .json, then recompiling it.

TL;DR

Download pbi-tools desktop CLI and make sure it’s in your path env variables
Decompile your .pbix using pbi-tools extract, referring to the pbix path
In the pbi-tools output, either programmatically or manually replace the field & table references in the broken visuals .json files. For each visual, you must loop through the key/value pairs that refer to tables, fields, or both.
Recompile your .pbix using pbi-tools compile, referring to the path of the pbix output folder
Reopen your .pbix file to confirm that the changes are done.
You may need to do some testing if you have complex visuals with a lot of formatting, to make sure you cover the necessary keys and don’t mistakenly replace other text that you didn’t intend.