How to Analyze YouTube & YouTube Music History with Power BI (or Excel)
MAKE A FUN POWER BI PORTFOLIO PROJECT
…by analyzing your YouTube watch history or YouTube music listen history
SUMMARY
Request your data via takeout.google.com
When the data is ready, download & extract it to an appropriate directory. Copy the filepath.
Open the .pbix or .xlsx linked at the bottom of the article, which contain some sample data
In Power Query (under ‘Transform data’), change the parameter to the filepath of the .json
Select ‘Close & Apply’ and the data will be transformed & loaded into the tables
Analyze the data how you like;
You can combine the data with other information from takeout.google.com (i.e. device used) or music metadata from musicbrainz (i.e. to get the track length or album names)
The starting point - analyzing music listening history
One of my favorite articles this year was by Matthew Roche, demonstrating how you can analyze your Spotify listen history using Power BI. Intrigued by my own listening habits, I wondered if this was something I could do with my platform-of-choice: YouTube Music (formerly Google Play Music).
Using personal data for learning
We know ourselves best, of all people. That’s why personal data is so interesting; we can easily relate to and interpret what we are looking at. It’s also a good learning exercise, because when it comes to analyzing and visualizing such data, we also become our own users. It’s a good exercise in creating something meaningful for answering questions and informing action; you quickly realize what works and doesn’t. Further, if you want to practice with a new tool or method, using personal data is a good way to do it.
In 2020 I did this in an effort to teach myself Python from scratch. I completed my first Digital Shadow Project, which was an exercise in collecting & analyzing data across two years - comparing 2019 with 2020. Given the onset of the pandemic, this yielded some interesting results. During that exercise, I collected data from a lot of sources: social media, wearables… in total I’d gathered 2 years of information from 13 services.

Click to visit my 2019-20 Digital Shadow Project, the data gathered in Python & analyzed in Power BI
Among these sources were two that I was very disappointed I could not get:
Listening history from Google Play Music
Daily playtime of video games from Steam
I could find evidence that both services were collecting this information, but neither had an easy way to get it. For Steam, I found the easiest way is setting up an RPA flow to get the data from my local desktop information. Interestingly, it’s also possible to see the playtime of other players this way, which is a bit - eh - odd… but that’s something for another article…
For listening history, this has recently gotten a lot easier, since Google Play Music has migrated to YouTube Music. YouTube history is logged in detail, and it’s available from Google’s data export service, takeout.google.com.
Request YouTube history data from Takeout.Google.com
Step 1: Request your export
View from takeout.google.com
If you haven’t yet checked takeout.google.com and what you can export, I suggest you do. There’s a wealth of information on there; a total of 54 services and many sub-services, with various data:
Log activity of what apps you used on which device and when
What you’ve searched on google
All your messages sent through google services, including any attachments
Any voice recordings from whenever you’ve said “OK Google…”
Your geo location history if you’ve opted in
… and a lot more

You can export various data, but for your listen history, just take “history”
It’s really eye-opening to see just how much information is available about you, especially when you realize that all those “OK Google” searches have been recorded as audio files. It certainly can make one feel quite uncomfortable…
But It’s also quite interesting to dive into that information and explore it. To get your YouTube history, of the 54 possibilities to export, you only need to select “YouTube and YouTube Music” (1 of 54). When selecting it, go to the menu and check off only 'history’, otherwise it will also give you an export of all your multimedia files that you’ve uploaded to the service, including music, YouTube videos and any images.
You can then select the format of the output file. Select ‘JSON’ for this exercise. You can later also select ‘HTML’ just to see what that’s like, but it’s not very helpful for analysis purposes.

Two file formats are available, HTML or JSON. Select JSON for analyzing or using your data.
You next have to confirm your export and specify how it should be delivered. Finish up this part, and your data will be put together for you rather quickly.
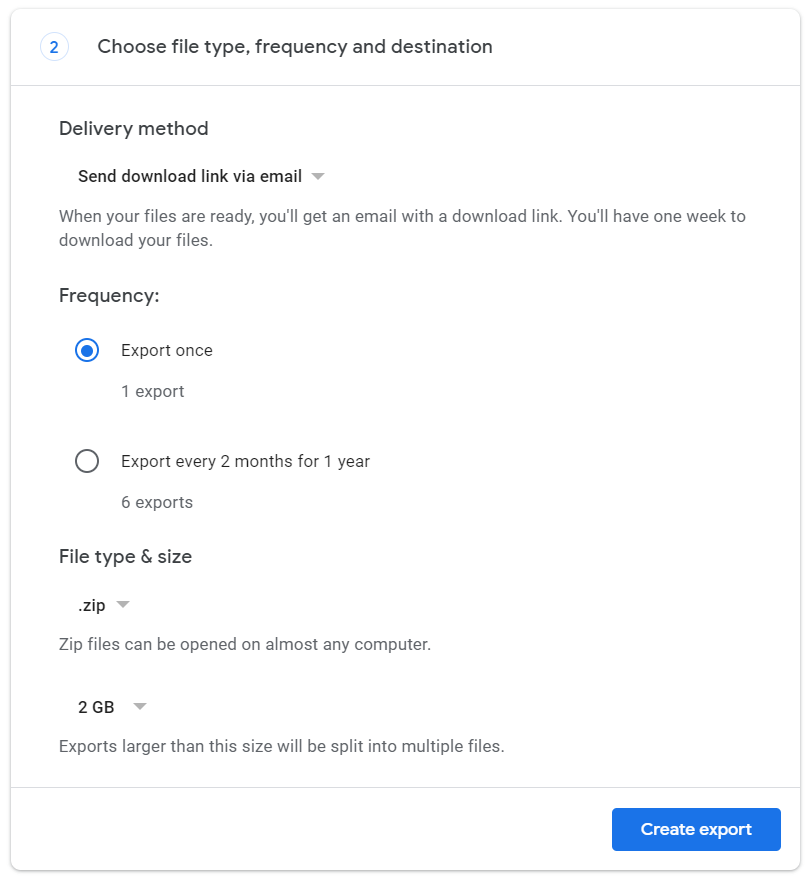
You can request regular exports as well as adjusting the compressed file type and size

The export takes up to 60 minutes depending on how much data there is.
If you select more data it will take longer, sometimes days for multimedia collections and the detailed stuff.
Going into the data
Step 2: Download and extract the files; copy the output file path
You will be notified by mail when your export is ready. Depending on what you selected, it will either be placed in your google drive or be available as a download. You can get and unzip the file to view the contents within.

The files are available for 1 week to download or can be placed directly in your G Drive.
You’ll have one of two outputs, depending on the format you selected. The HTML file produces scrollable blocks, whereas the JSON is better suited for analysis. For fun, I tried parsing the HTML file in Power Query with HTML.Table and CSS selectors. While a nice exercise in learning about CSS selectors, it was painfully slow and just not worth it for this analysis.

Output files for YouTube and YouTube Music watch history. Search history is also provided; not in this post
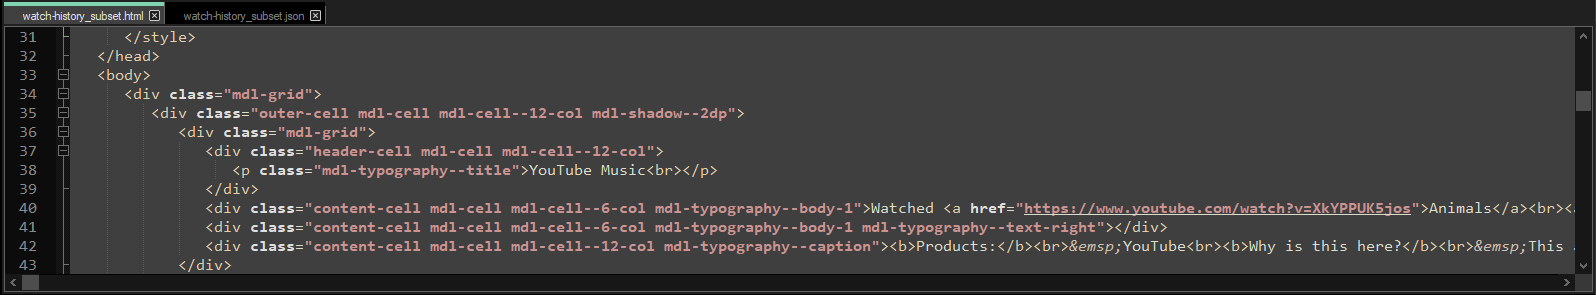
The HTML file is a chonker; the JSON is a much better format for analysis. I think they just have the option for HTML as the most human-readable format.
Visual Studio Code and Notepad++ could barely handle the 41MB HTML file on my gaming PC.
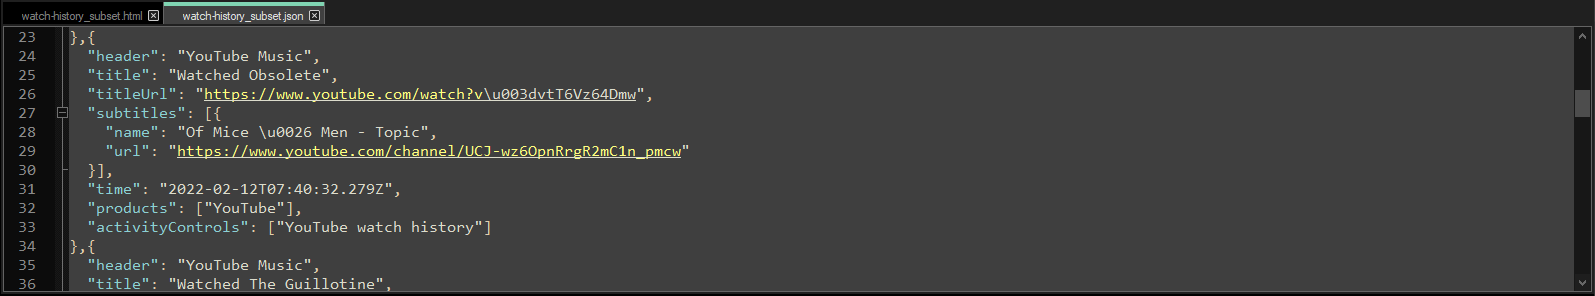
Sample of the JSON file. All songs are treated like YouTube videos. The only very useful information you get are title, artist, the link to the song and the link to the ‘channel’ of the artist’s page. It’s disappointing you don’t get more metadata like album, song length (listen time) or more.
Transforming the data for exploration
A note if you’re not familiar with Power BI
If you’re coming from the internet and aren’t familiar with Power BI, then hi! Power BI Desktop is a free tool for analyzing data and it’s really powerful for transforming, analyzing and visualizing data. It’s used by thousands of businesses to get value from their data, but you can also use it for fun personal projects like this.You can download it from the Microsoft Store for this tutorial and to open the .pbit at the bottom of this article, and read more about it on the docs site, here. There are also some nice learning paths from Microsoft that are totally free.
If you don’t want to download Power BI, you can also use the .xlsx file I included, too.
Step 3: Connect to the .json file from Power Query
If you’re using the sample .pbix or .xlsx files provided at the end of this article, you just have to paste the file path of watch-history.json into the parameter. Alternatively, if you want to try transforming the data with Power Query, yourself, it’s pretty easy. You just have to connect to the JSON and do some basic transformations to flatten the JSON and load the data.
Copy the path to the file (add the filename at the end)

Replace the parameter with your path (including watch-history.json at the end)
The main transformations I did are the below:
Filtered records that weren’t related to music or watch history
(They record qualitative descriptions of the weather & temperature when you open the app…)Separated YouTube and YouTube Music history
Cleaned song names by removing ‘Watched ‘ prefix
Cleaned artist names by removing ‘ - Topic’ suffix
Truncated listen time to the bottom hour (in the file I included alternate code to split date/time)
Added a composite key of artist-song to link to metadata I added, later
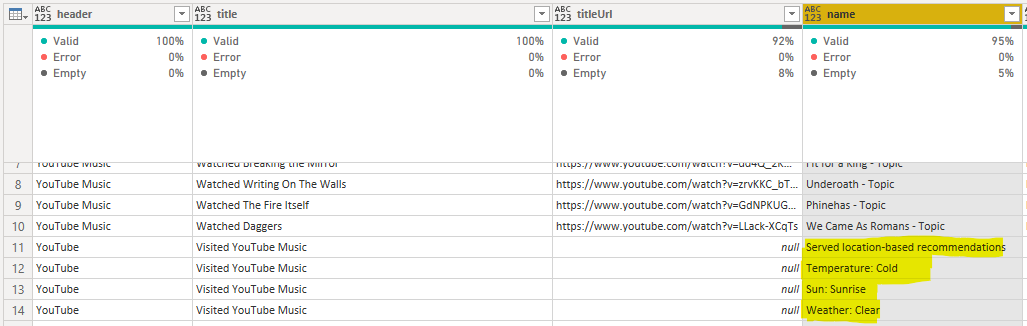
I was surprised that the listen history included temperature, sun height & weather info…
Above is the final table for Music History, after transformation in Power Query
Visualizing the Data
Step 4: Create some visuals to help you explore the data
Since everyone will be interested in different things, I won’t say much, here. For me, I was mostly interested in identifying my favorite bands & songs using a simple pareto analysis, what my listen history looks like by genre, and what I listened to during different times:
At the gym
Working
Not working
In general, I was a bit surprised by some of the results. I didn’t have much data, since YouTube Music only started in 2020, so I couldn’t compare year-over-year, yet. I just focused on the full-year picture for 2021. It was pretty clear that last year I fell in love with Fit For A King as well as Bo Burnham’s Magnum Opus, Inside.
[I’m still working on the report, but I’ll attach it here, later]
(Optional) Enriching with additional data
Step 5: Enriching with music metadata from Musicbrainz

Musicbrainz
I was quite disappointed when first looking at the data and seeing that basic metadata (like album, track length, genre) weren’t included from YouTube Music. I thought first about scraping it from YouTube using the links in the data itself, but this didn’t seem worth the effort. Thankfully, Matthew informed me about Musicbrainz, a free database of music metadata that had a number of resources to access this information.
Doing some reading, I saw that you could download a back-up of the PostgreSQL database for personal use. These .tsv-like or .JSON files can then be read and transformed, then linked to the data in your analysis.

Files you can download from Musicbrainz. It’s a 4GB compressed download of 13GB of TSV-like files.
Alternatively, you can download a JSON dump, which is maybe easier to work with.
This seemed interesting, but I didn’t want to download so much info when I only had 5000 unique tracks and a total listening history of 1.5 years; it seemed like overkill. Instead, I thought it would be fun to experiment with the musicbrainzngs Python API, to just call a function by row that could get the metadata. It was a fun exercise, but a bit slow - you’re limited to 25 results at a time and 50 results per second.
Nonetheless, below is an example of some code I produced that gave me what I needed, after a few hours just reading the docs & some helpful comments from others. I adapted this to run over the cleaned data in Power Query, which gave me the metadata I was looking for. Unfortunately, however, I wasn’t so happy with the quality of the data. Because I had only song name and artist, it wasn’t so easy to get good matches for some records. Stubbornly, I had to do a bit of manual data entry - like writing the genre for Bo Burnham (‘comedy’) or the album release date for ‘Holy Hell’ from ‘Architects’. I didn’t invest the time to write this back to musicbrainz, but I might still do that to contribute back to the repository from which I’m benefiting 😅.
Once you have your metadata, you can load it into your model to get additional information. It’s handy to keep as a reference file for future use, because the musicbrainz ID’s can be used to search additional data if you want to, in the future.
Thanks to Matthew for letting me know about Musicbrainz, and to the folks at Musicbrainz that maintain such a useful and interesting resource.
Running the Python function to get metadata for a given artist and song.
Sometimes metadata is missing, like “album release date” for “Holy Hell” of my favorite band, Architects
Python function to get music metadata for a given artist & song
I’m no Python expert, but experimenting with Python is super fun. Hopefully the below function is useful. To use it, you need to install musicbrainzngs (!pip install musicbrainzngs) and then initialize with a useragent (see the comments in the code).
You can adapt the code to get different metadata, or to do a less strict search (strict=False instead of True), or even use different inputs (by modifying the arguments to search_artist or to search_recording).
import musicbrainzngs
import pandas as pd

# You need to install, import & initialize the musicbrainzngs pkg first
# Don't forget to use musicbrainzngs.set_useragent('<your app name>', '<your app version>', '<contact site or mail>')
# Custom function expecting two input strings, the artist and song name
def get_metadata(artist, song):
    try:

        # Get artist musicbrainz id for use downstream
        artist_metadata = musicbrainzngs.search_artists(artist=artist, type='group', limit=1)
        id = artist_metadata['artist-list'][0]['id']

        # Get genre from tag list, if no genre, leave null
        try:
            genre = max(artist_metadata['artist-list'][0]['tag-list'], key=lambda x:x['count'])['name'].title()
        except Exception:
            genre = None

        # Get song metadata
        song_metadata = musicbrainzngs.search_recordings(arid=id, recording=song, type='Album', status='Official', strict=True, limit=1)

        # Get metadata as a dataframe (table), if missing leave null
        df = pd.DataFrame(song_metadata['recording-list'])
        df['album id']          = df['release-list'][0][0].get('id', None)
        df['album release dt']  = df['release-list'][0][0].get('date', None)
        df['album tracknr']     = df['release-list'][0][0]['medium-list'][0]['track-list'][0].get('number', None)
        df['album totaltracks'] = df['release-list'][0][0]['medium-list'][0].get('track-count', None)
        df['album']             = df['release-list'][0][0].get('title', None)
        df['artist id']         = id
        df['genre']             = genre

        # Include only a subset of the columns
        df = df[['id',
                 'title',
                 'length',
                 'album tracknr',
                 'album id',
                 'album',
                 'album release dt',
                 'album totaltracks',
                 'artist id',
                 'artist-credit-phrase',
                 'genre']]

    # Skip the song if looping through a few songs and one isn't present
    except Exception:
        pass

    # Return the dataframe. Can be modified to return a dictionary or other output
    return df
Step 6: Enriching with other data from Takeout
There’s a lot of other information you can use to combine with this. For example, you can use your activity log data to find the device you used to listen to the music, using the listen time and correlating that with the time when you accessed the app. You can also compare it with data from wearables to see how your heart rate changes when you listen to i.e. upbeat vs. sad music, or see what kinds of data you listen to depending on your mood (if you’re doing mood tracking with i.e. daylio). I did a quick correlation with my mood data, but I am not keen to publish my mood data, right now 😅
There’s a lot of possibility; I think sometimes with these personal projects, the hardest part is just deciding when to stop 😉 It’s worthwhile doing, especially when you want to learn something new!