How to set table or matrix column widths in a Power BI report

MANUALLY SET COLUMN WIDTHS
…by modifying the table columnWidth property in a .pbip report metadata.
REPORT METADATA IN POWER BI

One challenge of the table and matrix visuals in Power BI is that it’s difficult to precisely and consistently set column widths. Unlike in Excel, where you can set the row and column widths in a spreadsheet, you have no option in the visual interface to control the column width property. However, it’s still possible to control it in the report metadata, which is exposed in the officially supported Power BI Projects format (.pbip) which is in preview. Notably, however, opening and modifying report metadata from this format isn’t yet supported. Despite that fact, it still works reliably, so I thought I’d demonstrate how to do this.
Previously, I used to modify the report metadata using a combination of Python and Mathias Thierbach’s pbi-tools. You could simply decompile the .pbix to access the layouts.json and handle the metadata programmatically. Now, with the .pbip format (which is also thanks to Mathias, by the way), this is simple and straightforward in a few steps with an official format that’s supported by Microsoft. My hope is that it’s only a matter of time before we get a report metadata format like TMDL that’s also fully supported for these things.
 The purpose of this article is twofold:
1. To demonstrate step-by-step how to set column widths in tables and matrixes of Power BI reports.
2. To demonstrate the value of modifying report metadata exposed in the extremely helpful .pbip format.
STEP-BY-STEP: CONTROLLING COLUMN WIDTH PROPERTIES
To control the column width the first thing you need is an existing Power BI report that you can open in Power BI Desktop. This approach won’t work in the Power BI service. You also need to have a version of Power BI Desktop that’s May 2023 or later, as you have to use the preview feature to save as the Power BI Projects format (.pbip).
STEP 1. TURN OFF AUTO-SIZE WIDTH

By default, a table or matrix in Power BI will automatically set the column width. This works fine for most cases, but there’s reasons why people want to have consistent column widths. To suppress the column auto-size property, you need to disable it in the visual settings.
You can find the ‘Auto-size width’ property under ‘Column headers’ when selecting a table or matrix visual. Turn this off in this first step.
STEP 2. CHANGE WIDTH FOR EACH COLUMN
We needed to disable ‘Auto-size width’ to tell Power BI that we want it to remember the fixed ‘columnWidth’ property. However, it only does this once we’ve modified the column width after disabling ‘Auto-size width’ for the first time. Otherwise, the property isn’t stored.

To do this, we just have to manually select and modify the column widths of all columns in our table or matrix. We do this in the user interface by just dragging and dropping at the right place. Typically, I recommend that you make at least one column very large, and one column very small. This makes it easier to unambiguously identify these properties in the report metadata of the .pbip.
STEP 3. NAME THE PAGE

In the report metadata, the visuals and their properties are organized by ‘Section’. A section is a report page. It’s easier to identify the report pages if they have a display name, and not ‘Page 1’. Give the page a descriptive and concise name; this is a good practice, anyway.
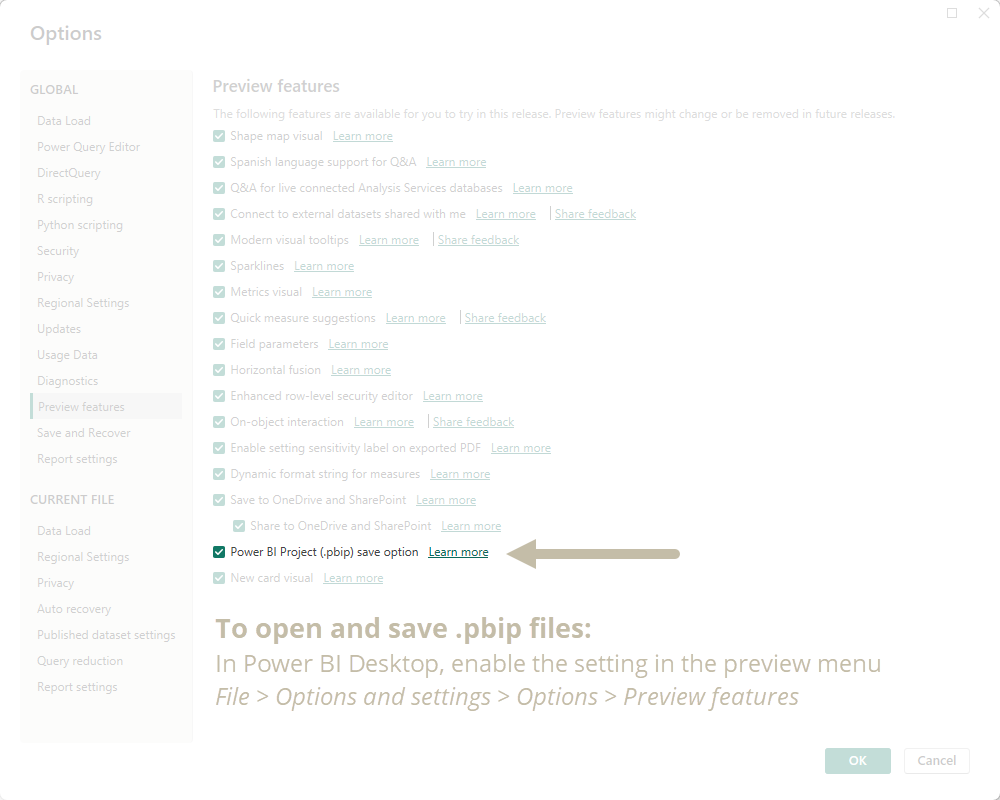
STEP 4. ENABLE SAVE AS .PBIP
You need to save your report as a .pbip file before you can continue. To do this, you have to enable this preview feature from the ‘Options’ menu.
STEP 5. SAVE AS .PBIP IN A NEW FOLDER
Create a new folder and save your report as a .pbip. Inside this folder, it will create a file structure including different files, which are all described in the Microsoft documentation (dataset and report folder).
STEP 6. NAVIGATE TO THE PBIP FOLDER
Go to the .pbip folder where you saved these files.

You will need to open the .Report folder (the second file / folder in this list)
STEP 7. OPEN THE REPORT.JSON FILE IN THE REPORT FOLDER BY USING VS CODE
This file contains the various metadata of your report, including:
Sections: Report page metadata, like names, page sizes, filters, etc.
visualContainers: A list of all the visuals on a report page (section) including their visual-level filters.
config: The properties and configuration of each individual visual in a messy, heavily-escaped JSON

The contents of a report.json file — the report metadata
You’re going to find the visualContainer for your table/matrix and update the ‘columnWidth’ properties.
STEP 8. FIND AND UPDATE THE COLUMNWIDTH PROPERTY (IN THE REPORT.JSON)
You can perform a CTRL + F to find the ‘columnWidth’ property. Pan right to find the “value” which is a floating point number that ends with ‘D’. This is the column width. You can change it to something consistent. Note that these properties occur in the order of your columns, so if you have many columns, you’ll proceed in order from left-to-right.

STEP 9. SET THE “VALUE” PROPERTY AND SAVE THE REPORT.JSON
Once you’ve made your change, you can just save the report.json and it’s done.
STEP 10. OPEN THE .PBIP FILE TO OBSERVE THE RESULT
You can just double-click the .pbip file to open it in Power BI Desktop to observe the result. The columns should all now be the same width, or whatever width you’ve set in pixels or points (I don’t know what the units are).


TO CONCLUDE
Accessing and changing report metadata has become easier thanks to .pbip. While this isn’t yet fully supported, there are still some very clear and easy use-cases, like setting the column widths. Hopefully in the future we’ll have a fully supported report metadata format so that we can programmatically handle these properties, and perform more advanced management of reports and visualizations in Power BI, in general…