


How to use Tableau with Power BI and Fabric

CONNECT TO POWER BI OR FABRIC FROM TABLEAU
…how to do it, why you might do it, and considerations semantic model developers in this scenario.
Short on time? Skip to the how-to’s with the buttons, below.
CONNECTING TO POWER BI SEMANTIC MODELS
A Power BI semantic model (formerly a dataset) is often a key, central component in a reporting ecosystem. The semantic model typically contains important business logic in the table structures, relationships and measures. These are used in central reports that deliver insights to data consumers in the business.
However, self-service users can also connect to a semantic model to perform their own analyses. This is valuable, as they re-use the logic defined in the semantic model to answer additional questions and address new use-cases. These self-service analyses can be done in a variety of client tools; users aren’t just limited to Power BI Desktop. This flexibility helps users get the most of their Power BI datasets with their skills and tools of choice, and without needing to copy data or rebuild existing logic.
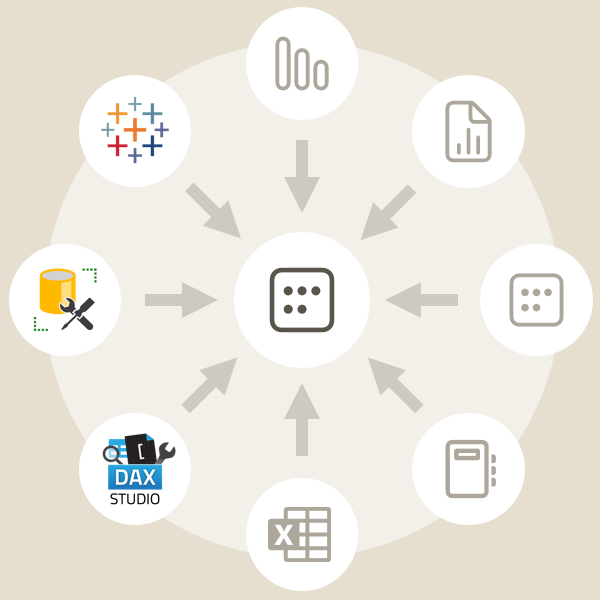
Below are some examples of tools that connect to and read Power BI semantic models, today:
Power BI items (Power BI Desktop or Service): Reports, paginaged reports, composite models.
Fabric items: Notebooks, Dataflows Gen2, Data Activator.
Office applications: Excel (Analyze-in-Excel and Live Connected Tables).
Third-party applications: External tools (like DAX studio) and other BI tools (like Tableau).
If you use Power BI, Fabric, or Excel, connecting to Power BI datasets is straightforward. However if you use other BI tools like Tableau, it’s not obvious how you can leverage a Power BI semantic model in your workflow. In this article, I’ll explain how to connect to and use a Power BI dataset from Tableau Desktop.
 The purpose of this article is threefold:
1. To explain how to connect Power BI and Fabric data items by using Tableau Desktop.
2. To consider why someone might use Tableau to connect to Power BI or Fabric.
3. To highlight key considerations for Power BI semantic model developers when they have Tableau users.
Disclaimer: In this article, I do briefly compare Tableau and Power BI, but I'm firmly uninterested in debating Tableau vs. Power BI (or Excel vs. Power BI for that matter).
That's like discussing Hammers vs. Screwdrivers; just use the hammer for nails and the screwdriver for screws.
WHY WOULD YOU USE TABLEAU WITH POWER BI / FABRIC?
Tableau - like Power BI - can be used to make interactive visualizations with different data sources. If you or your organization use both Power BI and Tableau, you might be confronted with scenarios where you want to make a Tableau dashboard from a published Power BI semantic model.

Tableau is another one of the 100+ self-service BI tools used in the market, today. One of the more popular tools Tableau is, an analytics platform that’s been around since 2003. It’s commonly known as a data visualization tool for creating and sharing elegant, interactive dashboards with a simple drag-and-drop user interface.
Tableau’s analytics platform consists of various offerings and tools:

The “marketecture” diagram of Tableau. It shows their conceptual arrangement, rather than their products. The little cartoon character is there because “Tableau Einstein” is the name given to their AI/ML features.
Tableau Desktop: The flagship Tableau product, Tableau Desktop lets users connect to and transform data, create calculations, and then use these data and calculations to create visualizations. Visuals are then combined to create dashboards, which can be published to Tableau Server or Tableau Public. Tableau Desktop requires a license to use.
Tableau Prep / Tableau Prep Builder: A visual ETL tool that lets users get and transform data that can be output to flat files or a proprietary format usable by Tableau Desktop. Flows created in Tableau Prep can be automated when published to Tableau Server. Tableau Prep requires a license.
Tableau Server / Tableau Cloud (formerly Tableau Online): An online platform where dashboards are published and shared with consumers, who access them via a web browser or mobile application. Tableau Server is the on-premises version, whereas Tableau Cloud is SaaS.
Tableau Public: A free, community-centric version of Tableau where users can create dashboards but only share them publicly. Tableau Public lets users create a public data visualization portfolio where they can display dashboards, follow other users, and let people download their work to re-use. Tableau Public is largely responsible for driving the active, highly-engaged Tableau community that exists today.
Tableau Embedded Analytics: A tool to programmatically embed Tableau visuals and dashboards inside of organizational or external applications.
Tableau Pulse (unreleased): Tableau’s generative AI tool, which is used to interrogate data using natural language queries, returning generated visuals to try and give the most effective answer possible.
Salesforce-related products: Salesforce acquired Tableau in 2019. Since then, Salesforce has been working for tighter integration between it and the Tableau platform. It’s still distinct; Tableau isn’t a workload of Salesforce, for example, like how Power BI is a workload of Fabric.
Tableau is a different tool from Power BI; they each have distinct features, strengths, and weaknesses. If your organization is making a choice between Power BI and Tableau, it’s important to understand these differences with respect to the use-cases and scenarios you expect to face.
That said, to reiterate, this section isn’t about debating which tool is better. Depending on your organization, team, and data, one tool might be better for you over another. As such, it’s important to know the differences between Tableau and Power BI.
Goblin Note:
I'm attempting to be objective in my language and information, but my work and articles focus on Power BI. As such, my text might include unintentional biases towards Power BI. Don't consider any opinions or statements below as bona fide facts or promoting one product over another.
If you need to compare Power BI and Tableau, please conduct additional research, for example by investigating both Tableau and Power BI documentation.
The main difference between Tableau and Power BI is that Tableau is a report-based tool, whereas Power BI is a model-based tool. Tableau is also generally known to be more flexible in data visualization and design, while Power BI is considered more rigid. Tableau focuses more on dashboarding, and the data visualization persona, and does that quite well. In contrast, Power BI provides a variety of ways to address business problems with data by using an elabourate ecosystem from ingestion to consumption; Power BI doesn’t focus on one persona, but caters to many. With the introduction of the end-to-end analytics platform Microsoft Fabric (of which Power BI is one part), this is even more true.
Some examples of other differences between Tableau and Power BI:
-
Power BI generally has a wider scope, covering many BI use-cases, while Tableau is more specialized in visualization and no-code ETL.
Power BI: Power BI is part of both the Power Platform and Fabric. As such, Power BI covers end-to-end BI solutions, where the end-product doesn’t have to be a report or dashboard, but could range from SQL queries to Excel pivot tables, and many things in-between.
Tableau: In general, Tableau is somewhat more specialized than Power BI. While Tableau does enable ETL with Tableau Prep, it’s generally specialized in creating powerful visualizations and facilitating self-service data analytics.
-
Power BI licensing is generally considered to be cheaper than Tableau.
Power BI: Downloading and using Power BI Desktop to create semantic models and reports is free. However, it’s not appropriate to share .pbix files as a means of report distribution. You need a Power BI Pro license to publish and share reports, and viewers also need to have a Pro license unless content is hosted in Premium or Fabric Capacity. If content is hosted in a Premium-Per-User (PPU) capacity, both content creators and viewers need to have a PPU license.
Tableau: You need a license to use Tableau Desktop, create dashboards, and publish/share them. While Tableau Public is free, it’s not appropriate to use for Personal BI with organizational data. To edit or view dashboards, different licenses are needed for Tableau Server or Cloud. There’ also Tableau Reader, which lets you view Tableau workbooks (but not edit and publish them).
-
Generally, Tableau is considered a superior data visualization tool compared to Power BI.
Power BI: While they’re performant and easy to cover basic use-cases, the core visuals of Power BI are infamously inflexible. Getting the core visuals in Power BI to behave the way you want takes significant effort, adjusting visual settings and even creating report-specific objects in the data model with DAX. Users knowledgable in javascript can create their own custom visuals using the Custom Visuals API, or download existing ones from online. Some visuals enable integration with Power Apps (i.e. for writeback) or Power Automate,
Tableau: Tableau focuses on using a “grammar of graphics” to create elegant, flexible visuals that allow users to fully flex their creativity when designing dashboards. The Dashboard Extensions API can also be used to create custom visuals or functionalities like write-back within a dashboard.
-
Semantic models are the backbone of Power BI, which offers a powerful engine and feature suite to support large and complex models. Tableau has limited data modeling capabilities.
Power BI: Lets you create tabular models that can be re-used by multiple reports, workloads, and tools.
Tableau: In Tableau, data sources are typically used by workbooks; there’s limited data modeling capabilities in Tableau, as it traditionally expected the workbook author to create one big table for each data source.
-
Power BI contains features to facilitate deployment, source control, and even CI/CD with Git integration. Tableau doesn’t yet have features for dashboard lifecycle management.
Power BI: Features like deployment pipelines make it simple to deploy changes between development, test, and production environments. It’s also possible to view and manage changes in content, or set up full CI/CD pipelines with automated testing and best practice validations.
Tableau: Tableau Server and Cloud have basic versioning, but no real pro developer features. This needs to be done with custom solutions, for example by extracting .twb or .twbx XML contents or even using their Hyper API. However, these custom solutions take significant time and effort.
-
Power BI generally has more integrations than Tableau.
Power BI: Tight integration in the Office 365 suite, Power Platform, and now Fabric. Power BI has a wide range of other integrations.
Tableau: Tight integration in Salesforce and Slack. Tableau also has many integrations, but the scale and scope of these integrations are much smaller than that of Power BI.
With these differences I don’t intend to say that one tool is better than another. I strongly encourage you to try both tools in your scenario, and draw your own conclusions that are most valid for your use-cases and needs.
There are various reasons why someone may want to connect Tableau to Power BI:
Large, hybrid ecosystems: Many large organizations have access to variety of BI tools used in the same region, department, or team. In these scenarios, people may want to use their tool-of-choice to conduct self-service analytics. To ensure effective governance, it’s important that people using different tools maintain consistency in the data, business logic, and calculations that they use. If Tableau users connect to quality Power BI models instead of creating their own data sources, they can focus on performing analytics to address business problems.
Migrations: When migrating from Tableau to Power BI typically proceed in stages. An organization may wish to start by migrating their data sources, but retaining their Tableau dashboards, until their Tableau developers can learn to create Power BI reports. Additionally, they may receive requests for new dashboards in that timeframe that they must address in Tableau, although the data is in Power BI. In this scenario, the reports could be (re-)connected to the Power BI dataset, avoiding disruption and improving agility during the migration both for the business and BI team.
Just because: A tool is just a tool. Some organizations might want to benefit from the powerful performance of the VertiPaq engine in Fabric or a Power BI model, yet use dashboards created in Tableau. If a self-service user knows Tableau and has a Tableau license, they should be able to leverage an existing, certified Power BI semantic model, instead of re-making all that logic, themselves.
Goblin Note:
Using both Tableau and Power BI can be expensive, as you incur licensing costs for both tools. If you intend to pursue this scenario, ensure you critically appraise if this is truly the most optimal way forward for your needs.
CONNECT TABLEAU TO POWER BI SEMANTIC MODELS
It’s possible to connect Tableau to a Power BI dataset natively, consuming it like you would another cube. However, there are some pre-requisites that you must deal with before you begin.
Tabular Editor connects using the XMLA read/write endpoint. This is a premium feature, meaning that you can’t connect to a semantic model published to a Pro environment, or a personal workspace that doesn’t use Fabric Capacity. You can’t connect to .pbix, .pbit, or .pbip files. The semantic model that you want to connect to must be published to a workspace with one of the below licensing modes:
Fabric capacity: You have an F SKU (i.e. F2 or F64), or an active Fabric trial capacity.
Power BI Premium capacity: You have a P SKU (i.e. P2).
Premium-Per User (PPU): You have a Premium-Per-User license.
Additionally, you also have to have a Power BI Pro license. If you are using a workspace with PPU, you also have to have a PPU license.
You need either Premium per-user, Premium capacity, Fabric capacity, or a Fabric trial capacity to use XMLA read/write.
You must have one of the following permission levels:
Power BI / Fabric Workspace admin role
Power BI / Fabric Workspace member role
Power BI / Fabric Workspace contributor role
Direct access to the model, with permission to modify the dataset (write permissions)
You need to have write access either through workspace roles or direct access.
You need to follow these instructions to enable XMLA read/write for your Power BI or Fabric capacity, if you haven’t, already.
Capacity setting: XMLA Endpoint: Read/Write (Default is Read only)
Admin setting: Allow XMLA endpoints and Analyze in Excel with on-premises datasets: Enabled
(Or enabled for a security group which you belong to)Admin setting: Users can work with datasets in Excel using a live connection: Enabled
(Or enabled for a security group which you belong to)
These settings need to be enabled to connect to Power BI from Tableau.
The “Microsoft Analysis Services” driver from Tableau (V12; last updated in 2014…) must be downloaded and installed. More about this from Microsoft docs.
You should download the appropriate drivers from the Tableau website.
Once you’ve completed all of the pre-requisites, you can proceed with connecting to the Power BI model.
Navigate to your workspace in Power BI and go to the Workspace settings. Select Premium, and at the bottom of the page, copy the Workspace connection. This is the “server” that we will connect to in Tableau.
Where to find the XMLA Endpoint in the Power BI workspace.
In Tableau, look for the left-hand Connect menu. Select More… under To a Server you want to select the Microsoft SQL Analysis Services connector. In the resulting dialogue, you can paste the XMLA endpoint in the Server textbox.
Open the SSAS connector and enter the XMLA endpoint in the ‘Server’ textbox.
Goblin Note:
We use an Analysis Services connector because Power BI Premium / Fabric Capacity is a superset of Azure Analysis Services. Originally, I was looking for an Azure Analysis Services connector. It's interesting (and incorrect) that you have to use the SSAS connector.
To connect to Power BI / Fabric, you have to use Azure Entra ID (formerly Azure Active Directory) authentication (with MFA if you have it enabled). Apparently, you can only authenticate with Entra ID if you enter your email and a single space as the password, under the Use a specific username and password option. This will prompt the normal authentication flow in a pop-up, where you proceed like you would expect.
If this doesn’t work, you can also try signing in using your actual username and password, though this hasn’t worked in my experience.
Goblin Note:
This is very likely why people have failed in the past to connect Tableau to a Power BI semantic model. There’s literally no way for you know this from the Tableau documentation or community site; you have to rely on some old blogposts that are now outdated.
I don't know if there's a precedence for this behavior, but this seems almost like an easter egg, to me.
You then have to select the semantic model from the workspace that you want to connect to.
Step 1: Select a Database: Select a semantic model from the ones that are in the workspace.
Step 2: Select a Cube: When you select a dataset, you’ll also have the option to select a Cube, which corresponds to the perspective object type in the Tabular Object Model (TOM). If the model has no perspectives, there will be an option with the same name as the model.
You must select both a semantic model and perspective to start developing the Tableau workbook.
You’re now connected in Tableau to a Power BI semantic model. Any time you refresh the data source, it will re-connect and get the latest data. There may be additional considerations if you were to publish this workbook to Tableau Server or Tableau Cloud, but that’s beyond the scope of this article.
CONSIDERATIONS FOR POWER BI DEVELOPERS
If you’re developing a Power BI semantic model that will be used in Tableau, there’s some important considerations you need to keep in mind.
MODEL THINGS THAT DON’T WORK AS EXPECTED IN TABLEAU
Some objects, properties, or features in a Power BI dataset don’t work in other client tools. For example, Field Parameters - which allow dynamic selection of measures or dimensions - work only in Power BI Desktop. When creating a model that you expect will be used by Tableau, you’ll have to take these considerations into account in model design, governance, and adoption.
The following objects and properties don’t work as expected when connecting Tableau to Power BI.
Hidden objects: When an object in the TOM is marked as Hidden, it’s not visible from Tableau, even if you enable Show Hidden Fields in the Tableau user interface.
Nested display folders: Tableau separates dimensions (tables and columns) from measures (DAX measures). Tableau can understand and show display folders, but will concatenate nested display folder names together, making them confusing and hard to read.
Field parameters: Field parameters don’t work. If you try to use them, they produce a data source error.
Dynamic measure format strings: Dynamic measure format strings don’t work.
Calculation groups: Calculation groups produce the expected result, but the Tableau UI will provide an error, saying this measure is incompatible with one or more of the dimensions in this view.
OTHER CONSIDERATIONS
Timeout: Like all XMLA tools, after ~15 minutes, the connection will timeout, produce an error, and the user has to re-connect / authenticate.
UNEXPECTED SURPRISES
Some Tableau functionalities are limited as it reads a Power BI semantic model as a cube data source. However, interestingly, some features in Tableau provide surprising functionalities when connecting to a Power BI semantic model.
You can rename fields: In the Tableau workbook, you can rename fields (dimensions and measures) to other names. This has no effect on the Power BI dataset; Tableau is not doing a write operation.
You can create calculated fields: In Tableau, it’s possible to create additional calculations using the dimensions and measures in the Power BI semantic model, already. These are effectively the same as thin-report measures in Power BI. It isn’t possible to create columns.
You can simultaneously connect to multiple Power BI models, or other data sources: This was really surprising. In Tableau, it’s fully possible to connect to multiple Power BI datasets in the same Tableau workbook. However, it’s not possible to combine those models, like a composite model in Power BI.
You can combine data sources with a Power BI dataset: It’s possible to use a Power BI dataset as a “primary data source”, then connect to a second (non-cube) data source, like an Excel file. The Tableau author can then blend those data sources to combine the data in their visualizations and dashboards. This gives a lot of flexibility and utility of the Power BI dataset, and seems like it would be very helpful to users.
Goblin Note:
The performance of a Tableau dashboard connected to a Power BI semantic model is surprisingly good.
In some preliminary tests, it seemed nearly comparable to the performance of a Power BI report with the identical visuals / queries set up.
CONNECT TABLEAU TO FABRIC
So we’ve covered Power BI, but how can you connect Tableau to Fabric? Thankfully, this situation is much clearer, both in terms of the use-cases and the protocol. In Fabric, there’s different data item types like lakehouses that produce SQL endpoints you can connect to from other tools like SSMS, Power BI Desktop, or Tableau.

Note that while this image depicts Tableau connecting to a lakehouse SQL endpoint, it could connect to any SQL endpoint from another item type, like a Data Warehouse or Datamart.
WHY WOULD YOU CONNECT TABLEAU TO A FABRIC DATA SOURCE?
Engrained in the DNA of Fabric is the notion that data can be transformed and made ready for consumption by multiple downstream workloads. In Fabric alone there are many different ways to consume data, from Power BI to Spark notebooks and the new Data Activator. It’s also possible to connect to these SQL endpoints from other tools like Tableau, and leverage the data from your tool of choice.
HOW TO DO IT
Connecting Tableau to Fabric is a simple process, but you still have some pre-requisites.
You obviously need to have an active Fabric capacity to create the Fabric data item, and connect to it. The Fabric capacity must be turned on to connect to and use the data item.
You need to have read access to the SQL endpoint. You get this through direct access with ReadAllData permissions (Read all SQL endpoint data) from the lakehouse.
Note that it’s currently (Oct 2023) not possible to set up data security from the lakehouse or SQL endpoint to a downstream workload. This means that someone from Tableau will be able to see all the data by using the SQL endpoint.
Ensure that you’re aware of this limitation. If you need security at the data source, follow up on the planned release of OneSecurity for Fabric.

You need to download the latest version of the Azure SQL Database connector for Tableau. This is just the latest Microsoft SQL Server driver; if you already have that installed, you likely don’t need this.
Note that Tableau Desktop doesn’t come with this installed, for some reason; if you try to connect without this, you return an error.
Once you have all the pre-requisites, you can connect to the SQL endpoint of your Fabric lakehouse.
Copy the SQL endpoint from the Fabric workspace. This is easily done by selecting the ellipses (…) on the SQL endpoint item, and selecting Copy SQL connection string. This will open a dialogue where you can copy the connection string (I don’t know why it doesn’t just immediately copy it to the clipboard, but hey…)
In Tableau, select Azure SQL Database from the list of connectors. Paste the SQL endpoint in the Server text box, leaving the default authentication options with Azure Active Directory via OAuth and the OAuth Instance URL being https://login.microsoftonline.com/common.
Click Sign in and you’ll be prompted to login via your browser.
Once you’ve authenticated, Tableau has connected and proceeds to show you the data preparation window. Henceforth, the experience is the same as if you’ve connected to any SQL database from Tableau.
You’ve now connected to the SQL endpoint. You can continue with some light data preparation in Tableau, then using it in your Tableau workbook to make visuals, dashboards and stories. Notably, it’s possible to blend this data with Power BI semantic models, leveraging the business logic in those models and linking it to any additional data you want to use.

TO CONCLUDE
Power BI semantic models in Fabric are a hub for consumers to perform self-service analytics in a variety of tools and workloads, including Tableau. This specific scenario—where Tableau consumes data from a Power BI model— is rare, but may become more prevalent as Fabric is adopted in more organizations.
Connecting Tableau to a Power BI semantic model is possible, but not obvious. It comes with some considerations both for the Power BI model developer and the Tableau dashboard author. For example, hidden fields aren’t visible, and the model is treated like a cube data source in Tableau. However, there’s also some surprising functionality in Tableau, like connecting to multiple Power BI models at once, or blending them with other data, including data loaded from a Fabric lakehouse SQL endpoint. Additionally, the performance is surprisingly good.
In all, whether you use Tableau to connect to a Power BI semantic model depends on your use-case and the tools at your disposal. Think carefully about whether you’re using the right tool to address the problem at hand, and take the necessary steps to investigate potential limitations and blockers.

