Measure Selection in Power BI

LET USERS CHOOSE MEASURES IN REPORTS
…by creating a measure selection experience, a very common & helpful requirement
Note: This article was originally published Sept 2020, discussing the SWITCH() method.
This update in Nov 2022 compares all methods and their use-cases / pros & cons.
Sample report available for download at the end of the article. 🔗 Click here for full-screen view.
CHOOSE-YOUR-OWN MEASURE ADVENTURE

Flexibility without complexity is key in well-designed, interactive reports. The report should be able to answer a wide berth of business questions within its design scope. To do this, users must be able to use interactions to zoom, filter and get details-on-demand. This is true not only for categorical fields on axes, slicers or filters, but also quantitative fields — measures.
Some users might want to see [Sales] while others want to see [Shipments] for the same view, and a small number of managers want to see [Forecast]. Instead of creating multiple pages & visuals, we can implement measure selection into our model for use in reports, often referred to in other tools as ‘Parameters’. Measure selection in this article is defined as a method where the user or visual chooses to display one or more measures in the report. A slicer to let users choose [Sales] or [Shipments], for example, or a bar chart that displays [Sales], [Shipments] and [Forecast] side-by-side; measures on an axis. This is a common requirement. Consequentially, there are many approaches to do this. But how should you do it? Which approach could you use for what use-cases and why? What are these different methods and how do they differ?
The purpose of this article is not to provide a tutorial for each method, since this is done in many other places. Likewise, the purpose is also to not provide an exhaustive, complete list of all methods; various permutations of the below methods exist and can be found online in other places. Instead, this article aims to provide an overview, comparing & contrasting the different methods.
By the end, we will see that there is no single “correct” or “optimal” approach, but that a combination of approaches is often needed to fulfill complex reporting requirements depending model & user needs.
OVERVIEW OF APPROACHES
In this article we’ll examine four different approaches. An overview of each is below. If you want more information, please expand the accordion menu items below the table, or consult the reference links adjacent to the description, in the table:
| Approach | Description | Reference |
|---|---|---|
| Bookmarks | Use Bookmarks to navigate to hidden pages or hide/unhide visuals | 🔗 Victor Rocca (2017) |
| SWITCH | Use SWITCH to conditionally evaluate a measure depending on the selected value from a disconnected Parameter Table |
🔗 SQL Jason (PowerPivot; 2012)
🔗 SQLBI (Optimization; 2022) 🔗 SQLBI (Optimization; 2018-20) |
| TREATAS with Calculation Groups | Use TREATAS to apply the data lineage from a disconnected Parameter Table to a Calculation Group, evaluating a measure in the respective Calculation Item instead of SELECTEDMEASURE() |
🔗 SQLBI (Article; 2020)
🔗 SQLBI (Video; 2020) |
| Field Parameters | Evaluate a measure in a special Field Parameter table based on the Filter Context, using the NAMEOF function |
🔗 SQLBI (Article; 2022)
🔗 SQLBI (Video; 2022) |
See also this video guide & overview from Johnny Winter of Greyskull Analytics, where a different Calculation Group method is discussed.
The “folder tab” is a button that activates a bookmark, navigating to a hidden page focusing on the difference between actual & target, rather than the “raw” actual & target figures, themselves.
Bookmarks can be used to show or hide visuals or navigate report pages, among other things. They can be used to replicate a measure selection-like experience with action buttons that activate the bookmark without altering the data state. It can be an elegant way to achieve this dynamic measure selection experience without creating new model objects; the user experience exists only in the report due to report elements. However, it also doesn’t represent a truly dynamic approach, and is limited in its application.

IF (
HASONEVALUE ( 'HT-Measures'[Measure] ),
VAR _SelectedMeasure =
SELECTEDVALUE ( 'HT-Measures'[Measure] )
RETURN
SWITCH (
_SelectedMeasure,
"Sales", [Gross Sales],
"Gross Profit", [Gross Profit],
"Profit", [Net Profit],
BLANK ( )
),
ERROR ( "Invalid selection. Please check filters." )
)
The oldest and likely most common approach to addressing this requirement is creating a DAX measure where IF or SWITCH (which is just nested IFs, anyway) return different base measures depending on a condition. Most often, this is based on the selected value(s) of a column in a disconnected table. A user filters this value, and the resulting measure is returned, depending on the DAX.
While simple to set-up and relatively versatile, this approach tends to run into performance bottlenecks with larger models or higher orders of nested expressions compared to other approaches. It thus requires more optimization effort, generally. However, any statement about performance must of course be followed with a weighted *it depends* … on your model, data & business logic.
CALCULATE (
[Dummy Measure],
TREATAS (
DISTINCT ( 'Parameter Table'[Measures] ),
'Calculation Group'[Measures]
)
)
Another, more complex approach — using Calculation Groups to achieve measure selection has only been possible since External Tools were able to connect to Power BI. This is because as of now (Nov 2022) there is no user interface in Power BI Desktop for creating Calculation Groups. Instead, they are most easily created from Tabular Editor, which can simply and quickly connect to Power BI datasets both locally and in Premium (dedicated or PPU) capacity.
This approach was explained by SQLBI in one of my all-time favourite articles, here. Please read it. In a nutshell, a disconnected ‘Parameter Table’ is filtered by a user to return values in the filter context, as with the SWITCH approach, above. However, instead of a conditional comparison of that value, the DAX measure applies the data lineage from the ‘Parameter Table’ to the Calculation Group using TREATAS. This effectively applies the filter context to the Calculation Group as if it were a normal table, selecting the corresponding calculation item for evaluation. Inside that calculation item, a measure is evaluated instead of SELECTEDMEASURE(), returning the result.
While obviously more complex, this approach might be attractive from a performance point-of-view. Since there is no conditional comparison, there is no risk of the SWITCH or IF performing a CallbackDataID. The details of CallbackDataID is beyond the scope of the article; however, in my experience, replacing SWITCH with a TREATAS approach in complex models might reduce DAX query evaluation times. Below are some performance data from a real business case as an illustrative example. Replacing the SWITCH approach with the TREATAS resulted in evaluation times on average 6x faster (n = 10; cold cache benchmark).
Please note, however, that this is just one example and not a general rule; performance will depend on many factors and is model-dependent. Testing different approaches for your use-case is essential to find the best result.
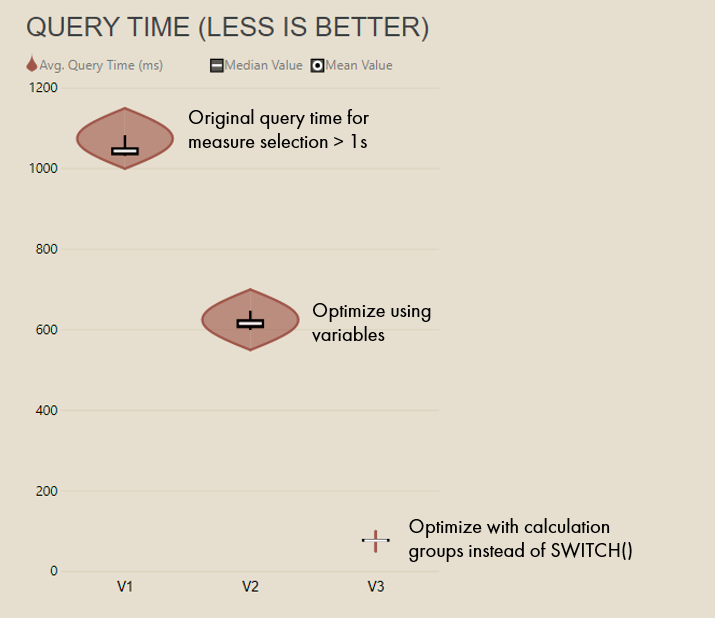
One case where measure selection performed significantly better with Calculation Groups vs. SWITCH
Violin plot of average DAX query evaluation time measured in DAX Studio from an extracted visual query; ~22M rows, complex business logic, ~4 layers of measure selection, n=10 cold cache tests
A double-edged sword with any calculation group approach is you gain both the benefits and drawbacks of calculation groups. On one hand, dynamic format strings allows for more flexible display of evaluated results, like different currencies and percentages. However, on the other hand, you have to deal with complexities like precedence and implications of composite models that can lead to unexpected results. Due to this complexity, this approach can be more difficult to maintain or handover to others. Further, it may prove problematic in self-service scenarios as users might be confused about which measures and model objects to use in their report. To mitigate this, model objects should be very hygienically handled, organized & displayed where appropriate, and users well-trained on how to use it.

Field parameters UI in Power BI Desktop
The final approach is the most recent (May 2022) and arguably the most simple — field parameters. What makes field parameters unique are they allows dynamic selection of both measures and dimensions; both a categorical and quantitative field can be a parameter. Making field parameters are easy; you can do it from the “Modeling > New Parameter” button in Power BI Desktop, or with a C# Script in Tabular Editor that creates the parameter for all fields selected. Field parameters are also a very optimized approach that leverage a new function NAMEOF. While not necessary to use field parameters, it is recommended you check out this linked article or video from SQLBI to understand how they work, especially if you intend to use field parameters in combination with other DAX objects, like calculation groups.
Field parameters have been hailed as a game-changing feature in Power BI that seem to be seeing wide adoption. However, there are some important limitations when using them in visuals, which we will discuss below. For example, it is not possible to use Field Parameters to place measures on visual axes, and they also do not work in Analyze-in-Excel pivot tables or composite models. This makes field parameters very limited in self-service dataset consumption scenarios, where they are an attractive solution, but only useful in a subset of cases.
USE-CASES
There are various reasons why you might need to implement measure selection; however, not all approaches work with every use-case. Most approaches work for a subset of use-cases only, and all have minor to substantial considerations to keep in mind. Note that bookmarks are a pseudo-dynamic approach; since they just redirect to another report page or reveal hidden visuals, they don’t actually allow you to fulfill any of the below requirements.
For further information on each use-case, please see the respective accordion menu item below the table.
Selection Experience: Use-Cases
| Approach | Selection on Report Page [1] |
Selection in Filter Pane [2] |
Measure on Visual Axis [3] |
Matrix Conditional Formating [4] |
Selection Layering [5] |
Analyze-in-Excel [6] |
Composite Models [7] |
|---|---|---|---|---|---|---|---|
Bookmarks |
O | ✗ | ✗ | ✗ | ✗ | ✗ | ✓ |
SWITCH |
✓ | ✓ | ✓ | ✗ | O | ✓ | ✓ |
| TREATAS & Calc. Groups | ✓ | ✓ | ✓ | O | O | ✓ | O |
Field Parameters |
✓ | ✓ | O | ✓ | O | ✗ | ✗ |
Measure Selection Approach
| Use-Case | Bookmarks | SWITCH | TREATAS & Calculation Groups | Field Parameters |
|---|---|---|---|---|
| Measures in report page slicers/buttons | O | ✓ | ✓ | ✓ |
The most common requirement, this lets the user choose the measure to be evaluated in the visuals using the measure selection approach. Depending on what is selected in the slicer, a different measure will be evaluated in the related visuals. All of these approaches will work with this use-case, except for bookmarks.
Bookmarks can be configured to give the illusion of a slicer-like selection, but they usually just direct the user hidden pages or visuals with different measures. The consideration for Bookmarks is thus that it isn’t a truly dynamic approach; it’s just a stand-in for when you want to avoid the other approaches, perhaps because the requirement is for a very niche use-case and you don’t want to create additional model objects (or thin-report measures).
Tip: If taking this approach, make sure you enable single-select on the slicer so that unexpected results aren’t returned.
Measure Selection Approach
| Use-Case | Bookmarks | SWITCH | TREATAS & Calculation Groups | Field Parameters |
|---|---|---|---|---|
| Measures selection from filter cards in the filter pane | ✗ | ✓ | ✓ | ✓ |
This is effectively identical to the above use-case with slicers. The only difference is that the selection takes place in the filter pane instead of the slicer. This use-case is possible with all approaches except bookmarks.
A few considerations if you do this with the filter pane, however:
Users can currently (Nov 2022) hold “ctrl” + click to select multiple items, even when single-select is on, which returns unexpected results. You should account for this possibility in your DAX expressions.
Users can press the “eraser” even when single-select is on, which returns unexpected results. You should account for this possibility in your DAX expressions.
It’s not possible at the moment to set interactions from the filter pane to report page visuals. Thus, if you want the selection to only apply to a subset of visuals, you have to use a slicer on each page, syncing the slicers and then setting the interactions.
Tip: If taking this approach, make sure you enable single-select on the slicer so that unexpected results aren’t returned.
Measure Selection Approach
| Use-Case | Bookmarks | SWITCH | TREATAS & Calculation Groups | Field Parameters |
|---|---|---|---|---|
| Measures on visual axis; measure names as dimensions in visuals | ✗ | ✓ | ✓ | O |

An example where 3 measures are placed on the X-axis of the waterfall visual, cumulating to the total.
This is done using a ‘Measure Selection’ approach.
Placing measures on visual axes is necessary to overcome certain limitations of Power BI visuals. A common example is the Waterfall chart. You might want to visualize a walk of your margin, going from the [Gross Revenue], deducting [Cost] and [Rebates], leading to the total [Net Profit]. A waterfall visual is perfect for this use-case, but it is not possible to add only measures to the visual fields. A workaround is to use a measure selection approach, where the ‘Parameter Table’[Measure Name] field is used on the axis, resulting in the respective measure evaluating for each category.
This might seem like an edge-case, but in the last reporting projects I’ve done, this was needed multiple times for each report. Interestingly, however, for field parameters this is not possible for all visual types, for example the waterfall, due to how visuals generate & use the field parameter queries. This is only possible across all visuals with either the SWITCH or TREATAS Calculation Group approaches, where the ‘Parameter Table’ field is used on the axis.
As illustrated below, an exception is for table & matrix visuals, where this does work with Field Parameters.
Measure Selection Approach
| Use-Case | Bookmarks | SWITCH | TREATAS & Calculation Groups | Field Parameters |
|---|---|---|---|---|
| Measures in matrix/table columns with conditional formatting | ✗ | ✗ | O | ✓ |

Conditional formatting of different columns in a matrix.
The user can add or subtract columns using a field parameter, to see more or less detail.
Related to the previous use-case, this is when different measures in the columns of tables or matrixes are given different conditional formatting. This is commonly used in customizable, pivot-like tables where the user can select the columns (and therefore the measures) to be displayed. Having distinct conditonal formatting in each column is a common requirement, but not possible to achieve with the SWITCH approach, since it’s a single measure being evaluated.
For the Calculation Group approach, it is possible, albeit complex. A good article by Bernat Agulló gives an overview of how this is accomplished, here. The considerations here are thus the complexity and level of understanding needed to achieve what is ultimately a simple requirement.
On the other hand, this is trivially accomplished with field parameters, where you can simply select & format the fields differently; there’s no difference than having each measure individually in the table or matrix.
Measure Selection Approach
| Use-Case | Bookmarks | SWITCH | TREATAS & Calculation Groups | Field Parameters |
|---|---|---|---|---|
| Layering; combining multiple 'layers' of measure selection in the data model | ✗ | O | O | O |

An example of a layered measure selection approach.
The user first selects a unit, then a price type (if Gold Pieces [value] are chosen), and finally the metric, before seeing the figures in the rendered visual or pivot table.
Layering refers to stacking multiple ‘layers’ of measure selection on top of one another; placing a measure selection approach which refers to another, upstream measure selection. For example, you might have a first layer selecting between quantity and value (Units). On top, a second layer might facilitate selection of [Gross Price] or [Net Price] used in other upstream calculations. Finally, a third layer might be allowing the user to switch between [Sales] and [Shipments]. A trivial example, but there are cases where this layering can get quite deep.
The purpose of this layering is as a specific model design to promote flexibility while limiting the number of measures in the model. If done well, it can produce a concise and elegant model. The problem is, however, that it can quickly become complex to understand. Further, depending on the complexity of the business logic, such an approach can easily introduce performance bottlenecks in the DAX code which can later become challenging to optimize due to higher degrees of inter-dependency between the calculations. Lastly, having layers of measure selection might not be obvious to self-service users consuming the dataset from other tools; they need good templates and training to understand what fields they should use for selection to get the results they expect.
For the SWITCH approach, this is possible but can very quickly spiral into a performance bottleneck. The considerations here thus pertain to optimization efforts needed to make this a sustainable approach.
For calculation groups, the considerations refer to the complexities inherent to Precedence, Sideways Recursion and Composite Models. While slightly safer with Parameter Tables separating the reference between calculation groups, neglecting these concepts may produce unexpected results. The considerations here thus pertain to complexity inherent in a calculation group approach.
Additional considerations for both the SWITCH and TREATAS/Calculation Group approaches are that they require creation of additional model objects. Particularly for Calculation Groups, which require both Parameter Tables and Calculation Groups. You thus might be losing any advantages gained in having a lean model with measures if you introduce excessive amounts of other calculation objects.
Lastly, for field parameters, this is also possible. However, it’s important to keep in mind that since this is often a core design of the model, doing it with field parameters will create extensive limitations; you will be unable to use any downstream objects in Analyze-in-Excel or Composite Models which refer to a field parameter, for example. The considerations here thus pertain to the application or usage scenarios of your model.
Measure Selection Approach
| Use-Case | Bookmarks | SWITCH | TREATAS & Calculation Groups | Field Parameters |
|---|---|---|---|---|
| Measure selection from Analyze-in-Excel pivot tables | ✗ | ✓ | ✓ | ✗ |
Measure selection from within Analyze-in-Excel, demonstrated using the Calculation Group approach.
Self-service consumption of data models happens mainly from Power BI Desktop or Excel. In Excel, the Analyze-in-Excel experience allows users to create dynamic pivot tables with a live connection to the dataset in the Power BI Service. Since these pivot tables generate MDX queries, it is not possible to use field parameters from Analyze-in-Excel. This is a strong limitation of field parameters for any model used in self-service consumption scenarios; field parameters will only be useful if the end-user is using Power BI Desktop.
Either the SWITCH or Calculation Group approaches work fine from Excel, however, albeit with the aforementioned performance considerations from the above sections.
Measure Selection Approach
| Use-Case | Bookmarks | SWITCH | TREATAS & Calculation Groups | Field Parameters |
|---|---|---|---|---|
| Measure selection from composite models | ✓ | ✓ | O | ✗ |
Creating a composite model will cause errors with the visuals using field parameter measure selection.
Composite models are unique and powerful solutions, allowing an end-user to switch from a live dataset connection to Direct Query. The end-user can then enrich that model with additional import tables, for example budget or master data mapping tables specific to their team or department.
There are a lot of important considerations with composite models, though. For measure selection we also need to take this into account. The strongest limitation is that field parameters do not work over Direct Query; it’s not possible to use field parameters in composite models for this reason. Further, there are important considerations for calculation groups, outlined in this article from SQLBI.
This means that if the data model will be used to create other, composite models by end-users, field parameters will not work. Further, you will need to take steps to ensure that any calculation groups produce the expected results, and that end-users understand how to use them. It’s thus important to define up-front the usage scenarios for your model; if it will be consumed in composite models or excel, then you cannot use field parameters.
APPROACH COMPLEXITY
To execute each approach you need to add things to your model and reports. The more things you need to add and maintain, generally, the higher the complexity. This is particularly true if you have a high need for measure selection across multiple reports. Very quickly, you can have a busy model with non-obvious objects.
For the bookmarks workaround, this is contained to the report-level, but is significant work; it costs a lot of time to implement and maintain this approach. This is because you need to not only create the bookmarks, but also add the objects like buttons and hidden pages… and (excuse the break from tone) maintaining bookmarks is an absolute pain in the ass.
| Approach | # Additional Report Objects | # Additional Table-like Model Objects | # Additional Model Measures |
Overall Subjective Complexity | Overall Time Cost to Implement |
|---|---|---|---|---|---|
| Bookmarks | MANY | 0 | 0 | ●●○○ | ●●●● |
| SWITCH | FILTER/SLICER | 0 | 1 | ●●●○ | ●●○○ |
| TREATAS with Calc. Groups | FILTER/SLICER | 2 | 2 | ●●●● | ●●●○ |
| Field Parameters | FILTER/SLICER | 1 | 0 | ●○○○ | ●○○○ |
APPROACH ‘QUALITY-OF-LIFE’ CONSIDERATIONS
There are some things possible with one approach or another that might not necessarily be functionally relevant, but more ‘nice-to-have’ features that improve the formatting or creator convenience. Again, keep in mind that Bookmarks are a workaround — not real measure selection.
| Approach | Keep Measure Format [1] |
Multiple Data Types [2] |
Keep Measure Label [3] |
Distinct Visual Formatting [4] |
Get Selected Value [5] |
Create with PBI Desktop [6] |
Create without Dataset [7] |
|---|---|---|---|---|---|---|---|
| Bookmarks | ✓ | ✓ | ✓ | ✓ | ✗ | ✓ | ✓ |
| SWITCH | O | ✗ | ✗ | ✗ | ✓ | ✓ | ✗ |
| TREATAS with Calc. Groups | O | ✓ | ✗ | ✗ | ✓ | ✗ | ✗ |
| Field Parameters | ✓ | ✓ | ✓ | ✓ | O | ✓ | ✗ |
This means that the format string (decimal place, etc) is retained, or consolidated in a measure. For SWITCH and TREATAS approaches, this is possible in two ways:
With an additional Calculation Group that handles dynamic format strings, or if using an alternative Calculation Group approach, altogether.
For visuals capable of rendering text (i.e. Cards, Tables) this is possible if wrapping the result in a FORMAT DAX function (discussed in this video from Greyskull Analytics).

This is whether you can - without adjustments or Macguyvering - have the data category label dynamically change to reflect the selection. This is only truly possible with Field Parameters; in the other approaches, it will only show the label of the measure.
To accomplish this with the other approaches you need to actually add additional dynamic text measures which detect the selected value from the parameter table and return it in a dynamic field (axis title or visual title, for example). This might be problematic as it introduces additional development and query overhead. This method is summarized below under “5. Get selected value”
This means whether the value returned can be a different data type. For example, evaluating either a string or a number returned in a card visual. In the SWITCH approach this is not possible; you cannot return, for example, “Invalid Selection” in a card if the user selects multiple values in the Measure Name slicer.
This is whether you can use the visual formatting UI to apply different formatting to different measures. Again, this is only truly possible with field parameters.
Sometimes you want to retrieve the context of what the user selected, for use in other purposes (i.e. a dynamic string for the visual title or Q&A visual). This is relatively simple using the SELECTEDVALUE function, except for Field Parameters you need to take additional considerations into account. This is summarized in this short article by SQLBI, here.
Whether you can create the solution with Power BI Desktop alone, or whether you need External Tools like Tabular Editor. Note that if you want to create Field Parameters in Tabular Editor, you should use the C# script provided here.
If you can create the solution without needing to author additional DAX or modify the data model. In shared capacities, this also is true when the creator only has read access to the dataset but still have build permissions to create their own reports. In this case, they can still create the “pseudo” measure selection approach with bookmarks, alone.

TO CONCLUDE
Measure selection is a common reporting requirement, but there are many ways to implement it. Once you have decided to pursue a measure selection use-case in your Power BI solution, it’s important to define the problem space and select an appropriate approach. Some approaches have limitations or considerations which may cause difficulties for other use-cases of your model. Understanding the differences & considerations between different methods will let you select the best approach for your solution, mitigating complications for your solution and model, down the road.