


Fix Power BI “Something is wrong with one or more fields”

HOW TO FIX ‘BROKEN’ VISUALS
…caused by changes that you or someone else made in the upstream semantic model.

When you rename or remove fields in the semantic model that’s connected to a report, it causes the visuals to ‘break’, returning the infamous “grey box of death”.
The “grey box of death” in Power BI is unfortunately a common sight for anyone creating reports. When you see this grey error box, it means that the visual can’t obtain a valid result. If that error says “Something is wrong with one or more fields”, then there’s several possible reasons for this:
You deleted one or more fields in the model that are used in the visual.
You re-named one or more fields in the model (or their table) and those fields are used in the visual.
You switched the data source of the report to another model (or version of the same model) which doesn’t have fields that are used in the visual.
A “broken” visual in a report, because a field was re-named in the model and the report doesn’t find it back.
Generally, these issues are called “broken references”. The report has a reference to a field and table, and when the report can’t find those objects in the semantic model it’s connected to, it returns an error. If you click the green “Fix this” button, it just removes the field. So most report creators solve this by removing the problem field (denoted by a warning sign) and then manually adding the “correct” field back. However, this is problematic for several reasons:
It’s time consuming. If you need to do this for several pages, visuals, or fields, it costs you dearly.
You lose formatting. When you add the new field, you need to re-do formatting, which is a pain.
You make mistakes. It’s easy to miss one or more visuals or fields, causing errors in reports.
There’s a way to solve this problem without manually replacing the fields. In a previous article, I shared a method to do this in .pbix files by using pbi-tools or Python. However, it’s now easier thanks to the Power BI Project (.pbip) file format. In this article, I’ll share how you can quickly and easily fix f
 The purpose of this article is twofold:
1. To demonstrate how to replace renamed measures, columns, or tables in report visuals.
2. To demonstrate how to "swap out" fields without re-doing formatting.
Thanks to Nicholas Lea-Trengrouse for reminding me to write this up.
VIDEO TUTORIAL
A 10 min. video below explains how to do this method end-to-end. But feel free to read the article for a short, written explanation.
WHAT YOU NEED TO GET STARTED
To use this approach, you need to save your reports as .pbip files. To enable .pbip files, navigate to: File > Options and Settings > Options > Preview Features > Power BI Project (.pbip) save option. Once you enable it, you’ll have to restart Power BI Desktop. Open your .pbix file again.
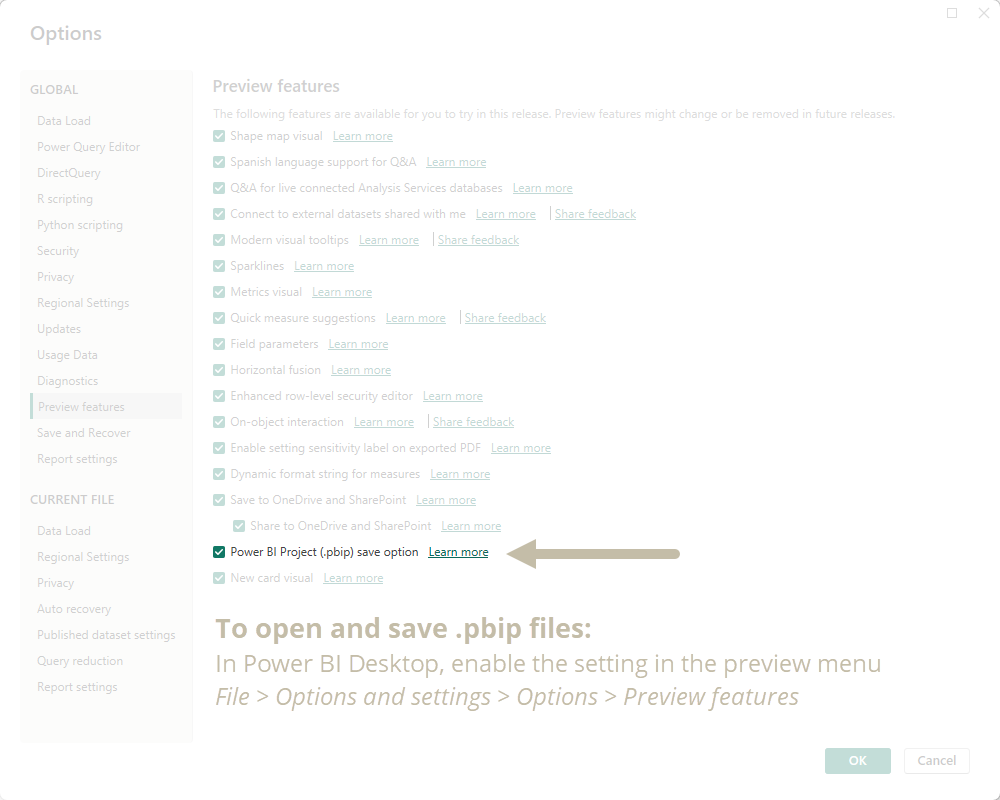
To use this method, you need to have the ‘Power BI Project (.pbip) save option’ preview feature enabled.
THE METHOD
The following steps describe how you replace a measure, column, or table reference in your report.
STEP 1: SAVE YOUR .PBIX REPORT AS A .PBIP (IF YOU HAVEN’T ALREADY)
The main difference between the .pbix and .pbip format is that a .pbix is a binary file, while a .pbip contains human-readable contents. In the .pbip format, you can actually see the report attributes (it’s metadata or the report definition). There’s many benefits to this, such as a granular view of changes to the report definition (called source control).
This is critical for us, because we can then read the measure references in the report visuals.
A goblin tip for .pbip files:
Create a new folder with the name of your file and save your .pbip in there. The .pbip is a folder structure, so encasing it in a single, top-level folder helps keep your .pbip files organized.

STEP 2: CLOSE THE REPORT AND OPEN THE .PBIP ".REPORT" FOLDER
Navigate to where you saved the .pbip file and open the folder that ends with “.Report”. In here is where we will find the information about how the report is defined.

STEP 3: OPEN THE REPORT.JSON FILE
Open the file called report.json. This .json file contains the report definition. It’s a heavily nested JSON that describes each property of your report. For more information about the report.json, you can check the schema on GitHub. I’ve also written about it in a previous series about pbi-tools, here.

A goblin tip for opening report.json files:
It's recommended that you open the report.json in Visual Studio Code. If you don't have Visual Studio Code, it's free to download and install. If you don't already have it, it's a useful tool for other Power BI use-cases.
STEP 4: BACK-UP THE REPORT.JSON
Everything up until this point is officially supported. Reading the report.json, saving as .pbip, and so forth. However, modifying the report.json is not officially supported by Microsoft, because you could accidentally make changes that “break” your report. For this reason, you should save a back-up of the report.json in case you make a mistake. If that happens, you can replace the report.json with your back-up.
STEP 5: FIND & REPLACE THE FIELDS IN THE REPORT.JSON
 Goblin warning:
This step is not officially supported... But would you seriously rather do all this manually by re-making all your visuals? That's up to you; it's a trade-off between what your time is worth vs. how much you're willing to wade out of your comfort zone.
With the report.json open, perform a simple “find and replace” of the reference that you re-named. Note that this will replace across your entire report. If you want to replace in only one visual, you need to first find that visual by searching for it’s name or property, then performing the find and replace in a limited selection.

In this example, the measure [Gap] in the ‘Orders’ table was re-named to [Gap to Sales Target].
To target the measure more specifically, we can use known prefix or suffixes, like ‘.’ and ‘\’ (before measures) or ‘\”’ (after measures).
Once you’ve made the changes, you can save the report.json and close it. The next time you re-open the report, it should contain the replaced fields, including formatting and text.
The fixed report. In less than one minute, we fixed the issue with a simple find and replace. When you have dozens of affected fields or visuals, this is a lifesaver.

TO CONCLUDE
Manually fixing broken references or swapping fields in reports is a waste of time. This is particularly true when you’ve gone through the painstaking effort to place a lot of custom formatting upon the visual. To avoid this, you can leverage the new .pbip format to open and bulk-modify the report.json metadata with a simple find-and-replace. While not officially supported, this saves me a lot of time, and is one of the many little secrets for how you can develop reports faster by not wasting time on mundane tasks.
If you do use this method, be sure that you first take a back-up of your .pbip or .pbix (or the report.json). That way, if you make unintended changes, you can restore the original version.

