

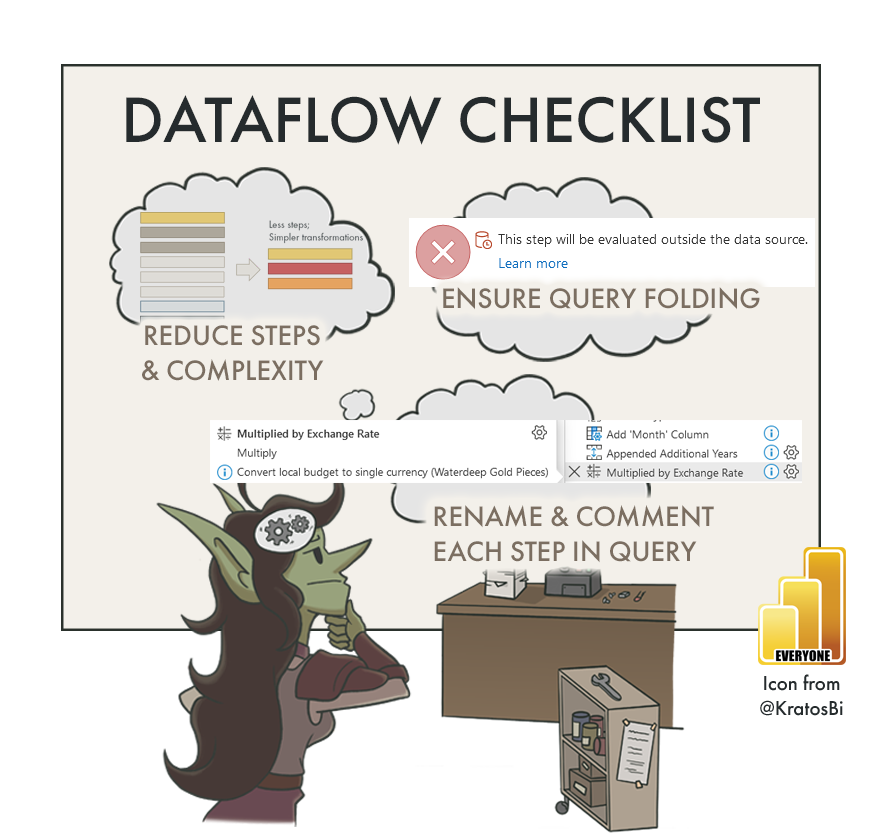
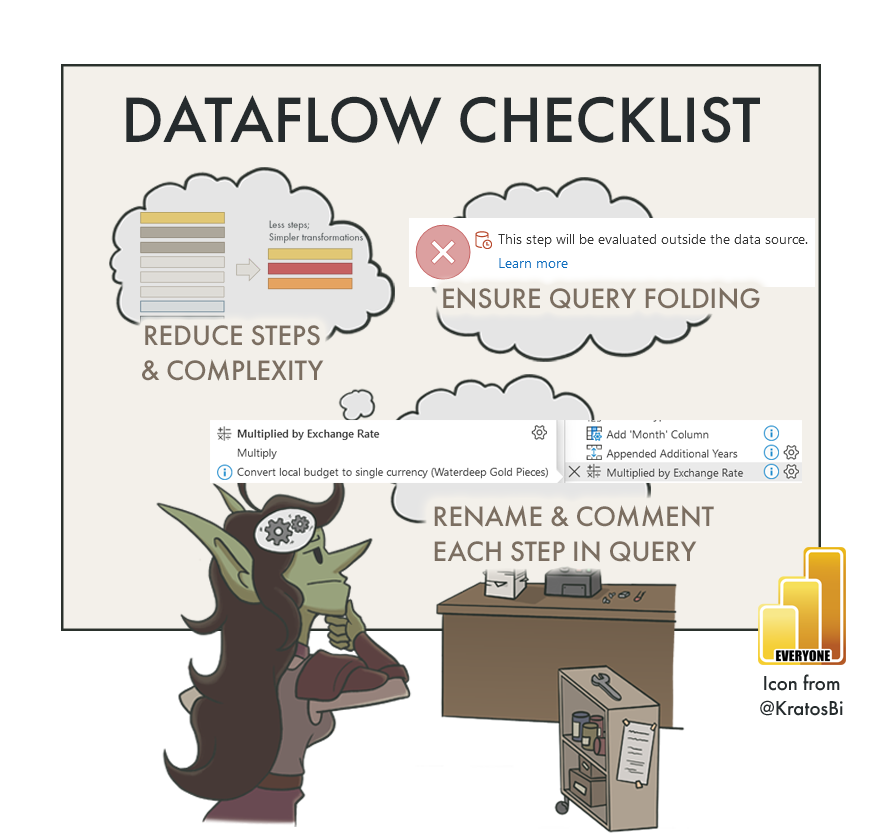
Power BI Dataflow Checklist
MAKING SUSTAINABLE & RELIABLE DATAFLOWS
Considerations for making good Power BI dataflows with Power Query Online
Note: While this article is a ‘Dataflows’ checklist, many of the tips can be cross-applied to any product using Power Query, from Excel to Power BI Datasets and others.
Check also the Power Query and Dataflows best practices from the Microsoft documentation.
It’s not the purpose of the article to repeat existing docs; I will only elaborate on undocumented points.

🔮 PART 1: HANDOVER OF DATASETS & REPORTS
CHECKLISTS
📝 PART 2: MODEL / DATASET
📝 PART 3: DATAFLOW 👈
📝 PART 4: REPORT
📝 PART 5: DASHBOARD
📝 PART 6: POWER BI APP
📝 TBD: ON-PREMISES DATA GATEWAY
📝 TBD: DEPLOYMENT PIPELINE
📝 TBD: PAGINATED REPORT
📝 TBD: ANALYZE-IN-EXCEL
📝 TBD: METRICS (FORMERLY GOALS)
📝 TBD (After GA): DATAMART

Slow or messy dataflows can become a bottleneck instead of enabling easier re-use of data & transformation logic.
DATAFLOWS IN POWER BI
A powerful and popular feature, Power BI dataflows enable users to centralize transformation logic with Power Query, storing shaped data in a managed, Power BI data lake. Using the intuitive Power Query user-interface, data can be filtered, aggregated, combined and transformed. While easy to create and use, Dataflows and Power Query in general contain a lot of underlying complexity that can make or break a data solution. Neglecting certain elements when making a dataflow can result in slow refreshes and large, unmanageable transformation logic. Given how quickly and easily a Dataflow can be created, shared and used, this can rapidly get out of control, causing bottlenecks and governance threats.
This can be easily avoided if a few key considerations are kept in mind when designing, building and governing Dataflows in Power BI. In this article, I list out key elements to note when making or managing a Dataflow, elaborating on points not already documented, elsewhere.

Power BI Dataflows Checklist - select items. Scroll down further for the full, up-to-date checklist.
ARE DOWNSTREAM USE-CASES & DEPENDENCIES MAPPED?
One of the most obvious use-cases for Dataflows are centralizing transformation logic, to ensure a “central truth” and avoid redundant, parallel logic in multiple solutions which risk becoming divergent. However, it’s important to define up-front what the final shape of the data will be. Missing columns or over-aggregated data will result in downstream consumers not being able to use the dataflow because it doesn’t fit their use-case. Thus, when designing a dataflow solution, it’s important to reflect on who the downstream consumers are and what their needs will be - “who will use this, and what will they use this for?” Try to define a common schema & detail level that fills all reasonable downstream uses of the dataflow, to best enable consumers to use it, even if they still apply slight aggregations or changes ontop. Examples are given below of situations to be avoided:
Dataflow misses columns needed in a downstream dataset or analysis
Example: Order reason field is removed from order data when it is needed for a DAX expression to calculate orders returned due to wrong size.Dataflow over-aggregates data past a detail level needed in a downstream dataset or analysis
Example: Customer detail is lost when sales data is aggregated to the region level, when there exists a reporting need for customer detail data.Dataflow applies a transformation that renders downstream requirements impossible
Example 1: Local currency transformed to EUR, when there exists a report requirement for seeing volumes in local currency or having dynamic currency conversion.
Example 2: Exchange rates rounded to two decimal places (Fixed Decimal) when 4-8 decimal places are needed for volatile currencies / rate types.
It’s thus important to be keenly aware of the reporting needs and scope when designing and constructing a dataflow, to ensure it delivers maximum value to the business.
IS THERE A BALANCE BETWEEN SIMPLICITY & OPTIMIZATION?
Generally, a clear sign of poorly-built Power Query is a long list of applied steps running the length of the right-hand margin. This often reflects an ad hoc transformation process by the creator, with redundant steps taking incremental (or even circuitous) routes to the final, desired data shape. This usually results in Power Query that is difficult to understand or maintain, and which struggles to perform with higher data volume or complexity.
To avoid or correct this situation, it’s worthwhile to plan out the Dataflow design ahead of time:
While not always necessary for smaller transformations, it’s helpful to define the desired endpoint for your data. Defining what you need helps you map out how to get there. Doing this mitigates that ad hoc transformation process, resulting in excessive or sub-optimal applied steps. It also helps you identify ahead of time specific solutions or code snippets which can be helpful to produce your desired result.
A survey of the available data is always necessary to define your starting point. Bridging between what you have and what you need is where the dataflow design comes in. While looking at the data, it can be difficult to see what you need in its structure, particularly if pivot and combine operations are necessary. Feel free to perform ad hoc transformations in a temporary query at this stage, but ensure to limit the data to not waste time waiting for data previews.
What can be helpful is using the Table.Profile function in Power Query to give an overview of the source.
Simply drawing out on paper or a whiteboard the steps needed to get the data in the desired shape may be helpful. It defines the core objectives of each group of steps. For example, you might be trying to get text data from a web source that has multiple pages. You may need to (1) Connect to the pages separately, (2) Identify the text elements, (3) Combine each page and (4) clean the result. In practice, there will be more steps than this in Power Query, but mapping out the data objectives helps keep that ‘endpoint’ clear.
Once you know the steps you want to take, you have to translate this to steps in Power Query, itself. Defining these steps makes it easier to search for or try existing solutions, favoring those which perform best on your data and are easiest to understand / implement.
Finally, you can implement these steps in the Dataflow, assessing the performance and complexity of each step. If you feel a particular set of steps take too long, or are too many, you can iteratively research and try alternative approaches.
While the number of applied steps are not directly indicative of poor performance as such, it’s important to think critically about better ways to approach a problem than a 12th “Replace Values” step.
On the other hand, however, overly optimized, complex custom functions or authored Power Query M code can also be problematic. Most users of Power Query likely use only the user interface, oblivious to the underlying code changes. If a solution is handed over that contains a lot of custom code copied into the Advanced Editor, it might be difficult for a future person to maintain unless it is well-documented or they have extensive knowledge of the mash-up language. Too often, I have seen users completely delete an optimized but complex code and re-do it all in the user interface when they needed to make a change. It’s thus important to be aware of the user context when a Dataflows solution is delivered or passed down, and generally to balance simplicity with the “optimal” solution.

Using dataflows to sail from
Bar Chart Bay to Insight Island…
TO CONCLUDE
Dataflows are a powerful tool that can sometimes feel like Pandora’s Box. It’s important to consider why the dataflow is being made and who is using it, and to follow best practices both for dataflows in general and the Power Query therein. By following a simple checklist of key considerations, we can ensure our dataflows become an important instrument to help us navigate our sea of data toward further insights, and away from governance risks & performance issues.
DATA GOBLINS DATAFLOW CHECKLIST
Version 1.0 - Last update: Oct 17, 2022
Use the below interactive checklist to follow-up on your Power BI Dataflow.
Many of these may also apply to any Power Query tool:
Click the question mark (?) for a link to a reference document. This will be learn.microsoft.com documentation; if none are available, this may be a Data Goblins article, or another blog post reference.

