


The value Power BI could bring to Academic Research

WHY POWER BI COULD BE VALUABLE FOR RESEARCH DEPTs
…for both operational and analytical reporting, to reduce cost & improve efficiency while improving transparency of how public funds are used.
I believe that Power BI - if successfully adopted & supported in a research department - has the potential to deliver tremendous value. By introducing business intelligence into research, researchers can focus on what matters most: more effective & efficient research. A research department using Power BI could conceptually…
Improve performance at scale by reporting on departmental KPIs like publications, technology transfer / IP, costs, funding, & more. This includes smarter forecasting & planning of resources.
Increase transparency & trust in how funds & data are managed with reporting
Improve data management with centralized ETL & storage in a managed cloud service
Innovate using self-service methods & interactive Power BI reports that improve understanding of research results
Automate manual data handling, allowing more time on research and less on menial tasks
Equip scientists with transferrable data skills in high demand among today’s labor markets
In the below article, I try to explain how…
This article is focused on scientific / biomedical research sectors, since it is my background, but parts can be applied to other research sectors, as well.
IN THIS ARTICLE
A Context:
‘Scientific Research’ - the background, users & problems Power BI would address
B. Value:
How Power BI could innovate & aid the academic research sector in many ways
C. Challenges:
Like implementing Power BI in any small company - adoption & change management
The Power BI Premium-Per User offering can provide a lot of value for an academic research lab.
INTRODUCTION
WHAT DO I MEAN WITH ‘RESEARCH SECTOR’?
In a previous life, I worked in a biomedical department at a university, doing research. Data was still at the forefront of everything we did, but instead of coming out of an ERP system, we got data from experiments. Instead of publishing reports and dashboards, we created figures and wrote research papers. Despite that, there are a remarkable number of similarities between Business Intelligence and scientific research. I’ve previously written an article summarizing these similarities, which I’ve updated & republished here.
To understand the data challenges faced by a typical [scientific] research department, and how Power BI could help, we first have to understand the roles and personas that operate, there. Again, this might be surprising, but there are many parallels to roles & responsibilities one might see in a company.
Note: This is of course coloured and generalized by my own experience, but I try to make it representative of the whole.
PERSONAS IN A RESEARCH DEPARTMENT: WHO ARE THE USERS?
A research lab has both internal and external stakeholders, each of whom have specific data needs, both from scientific as well as operational data. In the dropdown menus below is an overview of each of these profiles, and their general data needs.
Common personas found in a lab. Click below to learn about them & their general data needs.
-
Each lab is like its own mini business unit - or even their own company. A key difference, however, is that most labs are significantly more independent. Supporting departments in the research institute like HR, accounting, marketing, etc. are very rarely - if ever - involved in the daily operations of the lab. Instead, everything from funding to strategy and management flows through the professor who leads the lab - for better or worse. This means that every lab is fundamentally different in their operations, even within a single department or institution. It’s thus very challenging to have a high-level, operational overview of many labs in a group.
These professors - known as principal investigators (PIs) - are like corporate executives. Their roles are more strategic, but differ in that they often have much more hands-on operational responsibility to manage resources and people. PIs need to steer the scientific direction of the lab, and ensure that sufficient funding (i.e. revenue) from grants, awards or partnerships can overcome operational and scientific costs. They need to make sure their people are productive, completing experiments that work toward these objectives and attract new funding opportunities to keep the lab operational.
On top of that, PIs have many, diverse responsibilities including teaching and departmental tasks. This means that PIs don’t often have a lot of time to dedicate to one specific area in order to succeed in their role.
Their Data Needs
PIs thus need a high-level overview of a lot of diverse information, both scientific and operational, to successfully run their group. They don’t have much time and are under a lot of pressure to successfully manage their lab to produce robust, meaningful results for the department & society. This pressure becomes particularly challenging when labs engage in partnerships with private entities like pharmaceutical companies, who could appreciate visibility on their invested spend & delivered output.
-
Below the executives - the PIs - are other senior profiles who have decision-making authority over a section of the lab’s operations. These post-doctoral researchers (post-docs) or research staff lead teams of technicians, doctoral (PhD) researchers and interns in one or more research projects. Post-docs are usually transiently in a lab; they are domain experts working on a specific project for 2-6 years before they transition to another lab or apply to found their own group.
While still a management role, post-docs are usually still expected to spend the majority of their time designing and conducting experiments, as well. Further, it isn’t uncommon for them to help with lab or department operations, and fulfil teaching obligations, which can take a significant amount of time. In some labs, Post-docs also have part-time teaching responsibilities which may help fund their wages instead of research grants.
Their Data Needs
Post-docs also do not have much time, and are at an intense part of their career. They need up-to-date information from their teams on results and planned experiments, and need to ensure they have funding for their projects & scientific ambitions. Once funded, they need to work with the PI to manage costs.
Most importantly, however, is that Post Docs must be empowered with tools & technologies to store, transform & analyze their data, then convert this to powerful visualizations & figures. They need a lot of flexibility and ways to easily share and collaborate with data between colleagues, other labs, or even other institutes / private companies.
-
Technicians work in support roles for the lab. They manage the lab’s supply chain - the reagents, for example - and own specific techniques or solutions. Unlike post-docs or PhD researchers, technicians are permanent staff who aren’t expected to depart the lab. They are thus a valuable source of persisting knowledge for the lab; outside of staff scientists - which are rare - they are the only people doing actual experimental work who aren’t expected to turnover in a four-year period. This is often why many technicians are responsible for knowledge transfer by onboarding and training new hires.
Their Data Needs
Technicians need to be empowered with the right information and tools to be effective and govern lab supply chain, protocols & resources. Without this, they spend a lot of their time doing manual tasks. Further, technicians need to be supported with governance policies and processes to ensure that departing scientists leave their projects and data in good order, else remaining scientists may struggle to support projects the person who moved on had left behind.
-
PhD Students / Doctoral Researchers are responsible for a specific project, and usually report to one or more Post-Docs in addition to the lab PI. In most labs, PhD Students account for the most significant proportion of full-time equivalents (FTEs). While some project planning and decision-making is done by Post-Docs/PIs, a PhD student is largely responsible for independently driving their project, from design to execution, analysis and interpretation. They present their progress in regular steering meetings where Post-Docs/PIs provide input and make key decisions. In some labs, PhD students are also responsible for managing one or more master or bachelor students. The purpose of this, however, is usually to train these students, and for the PhD student to get experience mentoring and leading others.
Like Post-Docs, PhDs are expected to leave a lab after 4-7 years. The turnover of labs can be so high that there can be ‘generations’ that see the entire laboratory population except for the PI and technician departing.
Their Data Needs
The primary data needs of PhD students pertain to the management of their project. Like Post-Docs, they need tools to store, transform, analyze and visualize their results. They also need visibility on the lab inventory - reagents, protocols, etc. - and data from other projects that they can (re-)use or analyze.
-
These are students who are in a lab for 0.5-2 years, chiefly to learn and develop their personal and scientific skillset. Their responsibility chiefly pertains to a small project where they are contributing to broader work done by a PhD Student.
Their Data Needs
These users need to have easy access to tools and information available in the lab. They serve primarily as consumers of information, up until a certain point when they start to produce their own results. To support them here, they need tools that are easy to learn and have ways for seniors to monitor and govern their use, to supervise & mentor the work being done.
-
It is common for researchers to collaborate either with other laboratories or private corporations to collectively achieve their scientific objectives. These collaborations can be limited - between a few individuals - or on a massive scale, spanning dozens of institutions and countries. Often this collaboration is monetary, but usually it is more the shared labour and data to achieve a common research objective.
Their Data Needs
It’s essential that information can be shared using tools that securely enable collaboration between groups and across institutes / organizations. Collaborators need transparency on what is being done (governance, oversight) and ways to collaborate, share and use data and results. Further, it’s important that resources are fairly used and shared, and that funding bodies have visibility on the money being used in cross-border collaborations.
-
The final output of a scientific lab are scientific publications. This peer-reviewed literature packages and shares their research with the public, building upon the body of existing knowledge.
Today, scientific data is packaged in mostly static figures or videos which are present in the publication, both online and in print. Depending on the research and journal, labs may also provide the raw data for transparency, or to aid re-usability of the information for other analyses.
Their Data Needs
Peers & public consuming scientific information need to understand it. They need accessible, effective visualizations which allow them to understand the work done. Other research groups need to be able to explore and dive deeper into the data, particularly for larger datasets generated in many bioinformatics or ‘omics’ studies, today.
-
These are people responsible for ensuring the sustainability and success of a collection of labs. They are usually a committee of PIs or sometimes externals who together steer the overall strategic / operational direction of the group.
Their Data Needs
These people need a wide perspective, focused on operational data. They must have an overview of the key performance indicators from each lab, to monitor funding, spend & productivity. This will empower them to make better decisions more effectively about how to run their department / institute.
HOW POWER BI CAN BRING VALUE TO THIS SECTOR
Each lab in a department faces their own challenges, though many are common. Data management, high and expected turnover, and tight margins between funding & costs, to name a few. Power BI can aid with each of these challenges by providing fast, actionable, self-service insights on data.

1. DATA MANAGEMENT & CENTRALIZATION
CONTEXT
In a research department, data is typically owned locally by the researcher as flat files stored on their computer or a shared drive. Exceptions are - for example - when patient data is used, which necessitates stricter data management policies. Outside these cases, its up to the given PhD student or Post-Doc to manage their own data and analyses, the governance of which varies tremendously between labs and individuals. Further, operational data from funding and orderbooks to publication records and technology transfer opportunities are collected & managed manually in Excel, ad hoc, or in some cases, not at all.
THE CHALLENGE
This often leads to significant data management challenges. For scientific data, these challenges are often pragmatic. Who has what results, where? How can they be securely and efficiently shared for other analysis or feedback? When were these results obtained, and have they been modified? How was this data transformed / analyzed? In some departments, answering these questions is often difficult if not impossible, creating many issues. This is particularly problematic due to the high turnover rate of FTEs in a lab - if anything, research departments should see higher than average data management policies, to ensure no productivity disruption as labs cycle between generations of scientists.
HOW POWER BI COULD BRING VALUE
If a lab was using Power BI, all results and data could be shuttled with automated data pipelines into a central cloud storage location using Power BI Datamarts or Power BI Dataflows. This central repository would hold all of the lab (meta)data in a model that becomes the single-point-of-truth. For sensitive data, Row-Level Security could be set up to limit who can see what. This makes the consumption and distribution of this data easier, more secure, and more transparent, providing a number of practical advantages. Furthermore, it enables centralized reporting of this information from a single-version-of-the-truth; gone would be the days of digging through files to scrape together answers to important questions.
A vision of what self-service business intelligence could look like with Power BI in academic research
Scientific Data Self-Service: A Central Database for Consumption & Analysis
Users could connect to the Datamarts with tools like Python or Power BI Dataset composite models to analyze or further enrich the data, before visualizing the results within Power BI Reports.Data is Safer & Easier to work with in the Cloud
Scientists leverage cloud resources instead of local computing & storage, making it easier and safer to work remotely and collaboratively.Read-Only Consumption Experiences
Junior scientists or collaborators could be given read-only access to Datamarts or Reports, to consume the data without risk of data loss or alteration.Transparency & Monitoring
Senior Scientists can have visibility on who’s doing what with activity logs & monitoring reports.
2. PROVIDE BOTH SCIENTIFIC & OPERATIONAL REPORTING
CONTEXT
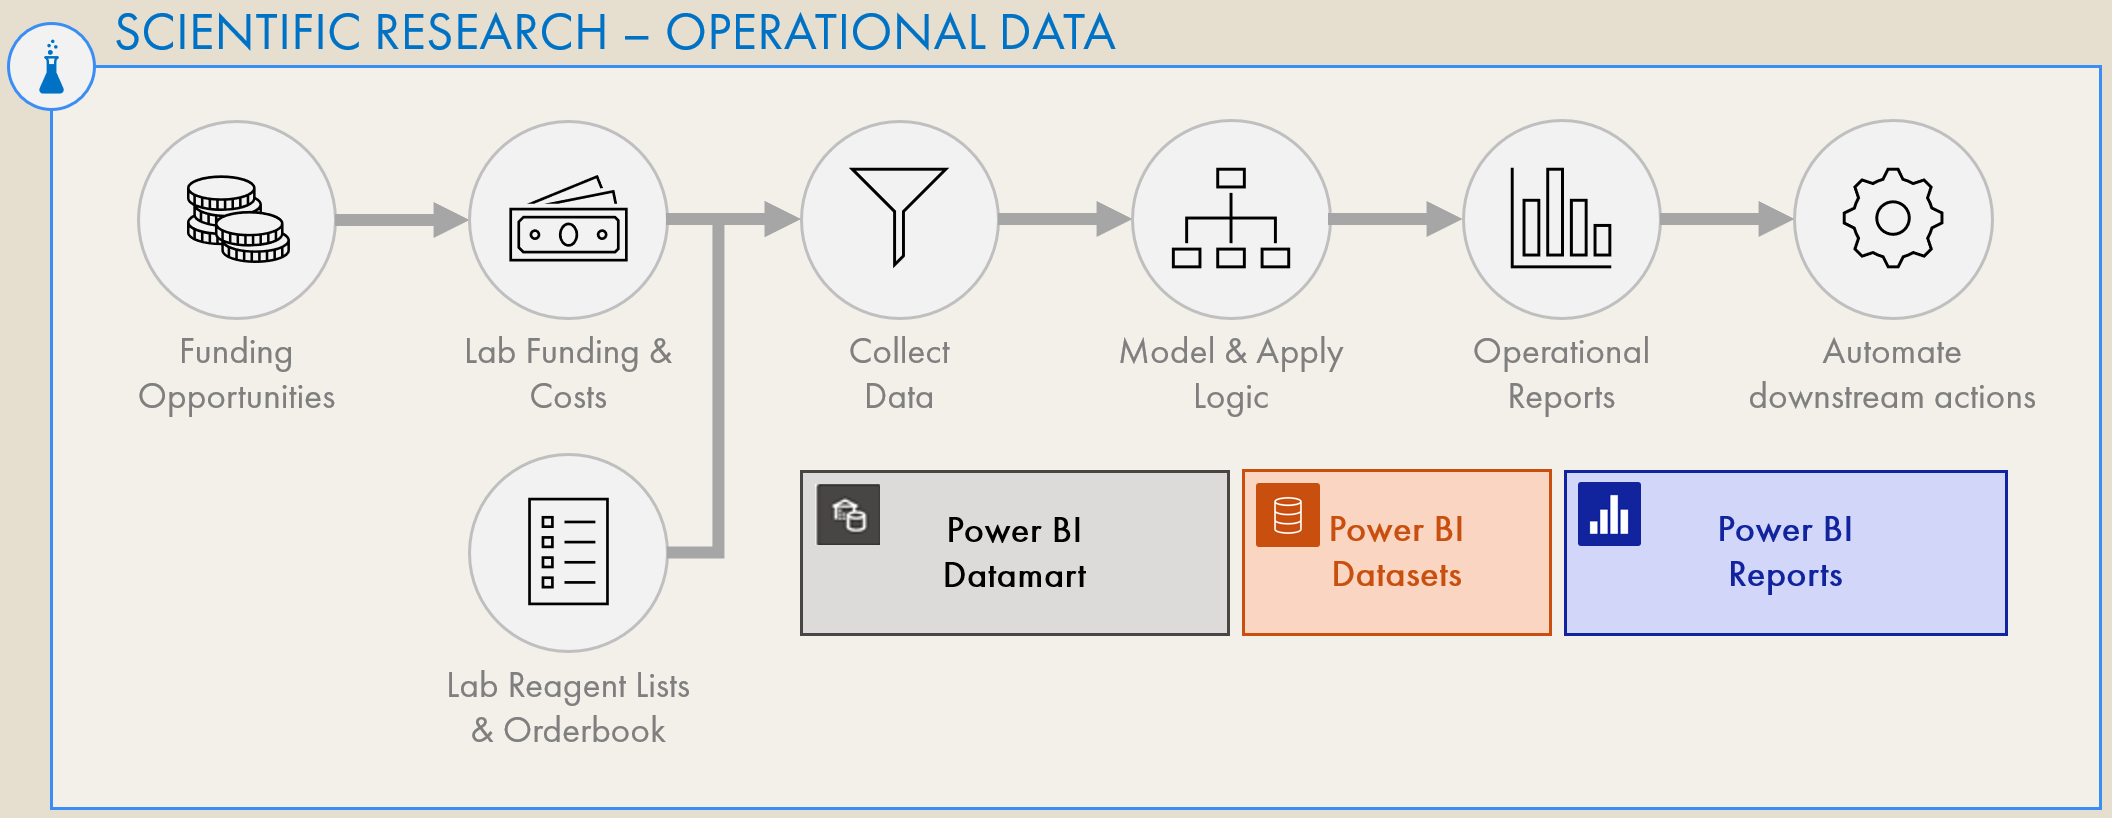
A laboratory handles not only scientific but also operational information. For example, each lab has their own miniature supply chain - reagent lists need to be maintained and orderbooks up-to-date to ensure sufficient inventory to conduct experiments. Each lab also has their own P&L through funding & costs. Costs must be managed against the available funding, and there should be visibility on an opportunity pipeline to make sure each scientist and project has applied to the appropriate research grants on time. Finally, there must be visibility on the data assets and research activities within the lab for PIs to be aware of timelines.
THE CHALLENGE
In most labs, the above is a manual and ad hoc process; operational reports might not even exist, at all. In general, visibility on operational information is low, compared to a corporate setting. it is not uncommon for a lab to have no dashboard or cockpit overview of their operational situation. A PI or Post-Doc might have no visibility on the spend of the lab or project unless specifically requested, and instead of checking a dashboard to see project timelines, they are updated only verbally in steering meetings. This makes management of operations an inefficient and laborious task. Further, absence of robust reporting on costs vs. funding create significant risks of wasted lab resources. This is particularly problematic, since most labs are funded with public resources.
HOW POWER BI COULD BRING VALUE
A Power BI solution could ingest this operational information together with scientific data, providing a unified source of all lab data. Again, sensitive information like costs or funding could be restricted from certain individuals while still enabling management & operational reporting. Automated, up-to-date Power BI reports could then be made from this operational information, yielding visibility and insights that can improve management of the lab. These reports would also create visibility and transparency to key external stakeholders like department chairs, funding bodies and external collaborators, potentially increasing the trust & professionalism in these monetary partnerships. With scientific research this is particularly important - if not an ethical responsibility - since the research is often funded with public money. Transparent reporting is thus a key ingredient to ensure accountability and responsible use of public funds. Example reports that could be created for any lab include:
Conceptual overview of the holistic reporting experience a lab could have with Power BI.
Department or PI Overview
A high-level 360’ management report showing the key performance indicators (KPIs) of the department or lab and up-to-date overviews on costs, projects & other actionable items. This could be a central hub to help PIs and Post-Docs manage (parts of) the lab. KPIs could include things like:Number of Publications & Average Impact Factor
IP & Tech. Transfer opportunities or assets
Available Funding & Current Spend
Number of Projects & Statuses / Milestones
Lab Spend Reports
Reports showing the period-to-date spend of the lab against their available funding. Such reports could break down the cost of each project and spend per scientist, highlighting actionable items like anomalous costs, expensive reagents or projects that risk exceeding their budget.Funding & Tech. Transfer Opportunity Pipeline
Reports showing future funding opportunities, their monetary value and timelines. These reports can facilitate planning and actions to support grant application, and motivate scientists to seek and manage new funding opportunities, for example with corporate partners.Supply Chain Reporting - Lab Stock
A searchable report that shows stocklists and reagents with both quantity and value. These reports could make it easier for scientists to find what they need to plan & conduct experiments, and to know what still needs to be ordered. By integrating write-back functionality, it’s conceivable that it becomes a full demand planning experience; a unified portal to manage and quantify the labs inventory.Project Reports
These reports on experiment metadata could highlight to Post-Docs and PIs the progress of key projects. They would show how many experiments were done, what failed and why, and what is planned for the future. In a single view, PIs could see the status of each project and the latest result of each experiment, without needing to ask scientists to prepare meetings & presentations. Discussions could happen within the reports themselves using comments, making it easier to communicate and collaborate.Publish-to-Web Figures
When ready to share their findings with the scientific community & lay public, a lab could publish-to-web their reports, allowing anyone to use them to explore their data interactively in an easy user experience.
3. INNOVATE SCIENTIFIC FIGURES USING INTERACTIVE REPORTING
Example of a scientific figure with panels A-I.
They are not interactive, & show a lot of information.
CONTEXT
The final output of an experiment is typically a visualization of the results. These visualizations are typically organized into panels in a figure that tells a specific story. Multiple figures are put together in a publication, which provides context, explanation and interpretation of the data, as well as describing how the data was collected and analyzed.
THE CHALLENGE
The complexity of these figures and the amount of data they communicate is increasing over time. This makes it harder for a reader to understand the results and conclusions of the research, and sometimes impossible for peers to explore and interrogate the data unless it’s provided as supplemental files. Despite the constant innovation in science and the increasing size & complexity of datasets analyzed, the creation of figures as static visualizations has largely remained unchanged for decades. Here, interactive reporting tools like Power BI offer innovative solutions by allowing data exploration at the speed of thought:
Hypothetical example of a small interactive figure. (Cross)-filtering & other interactions can be extremely innovative for scientific figures.
HOW POWER BI COULD BRING VALUE
In Power BI reports, the visualizations are interactive. Tooltips provide context information about the data, and underlying data points can be interrogated by showing the chart as a table. Most importantly, however, the data can be filtered and sliced by different dimensions. This means that a scientific figure doesn’t have to have 28 panels A-Z, but instead can rely on interactions of a user to navigate the information from a single view. This interactive experience makes it easier to share more data more concisely, and can even aid in the understanding and interrogation of the results. Through interactive exploration and filtering of the data, someone looking at the figure could find more insights than if it was just a static image on a page.
Such interactive visualizations would improve a reader’s understanding of the results, and therefore the science. It could serve as a catalyst for future scientific work through data storytelling - empowering readers as users; active engagers with the data, rather than passive observers.
4. AUTOMATION
CONTEXT
After an experiment, the collection and transformation of the data is typically a manual process. At best, data is transformed using notebooks (i.e. Jupyter or Google Colab) or custom-developed software. Not all scientists get computational training, however, resulting in limiting their analyses to no-code or low-code tools like Excel or GraphPad Prism, where data is copy/pasted and stored in local files without version control.
THE CHALLENGE
Manual data handling processes result in wasted resources & increased likelihood of human error. Further, like an experimental protocol, the analysis should be repeatable and well-documented. Addressing these challenges means automation - and Power BI can provide an easy way to do this, accessible to any user.
HOW POWER BI COULD BRING VALUE
As mentioned in (1), in Power BI, we could create centralized ETL pipelines using Dataflows or Datamarts to automate these transformations. Design of these pipelines is extremely easy to learn thanks to the Power Query user interface, but is also very flexible. Power Query transformations even allow integration of R or Python. Once designed, tested and deployed, these pipelines could make data collection & transformation a completely hands-off process - from picking up the raw data output to producing the final visualization in the Power BI Report.
Operational reporting described in (2) could also automate handling of reagents and costs, saving time that senior scientists and PIs spend on these tasks. This is beneficial as they can spend more time focusing on science over repetitive tasks that are both less valuable and interesting.
5. EQUIP SCIENTISTS WITH TRANSFERRABLE BI SKILLS
CONTEXT
The majority of scientists who work in a lab will end up working in industry, in a corporate setting. While scientists learn a lot of valuable skills in a lab, their scientific skills for specific techniques are truthfully not usually transferrable to such settings.
THE CHALLENGE
It can thus be challenging for some scientists to transition to industry work, particularly if they worked in fundamental research. Usually many will need to upskill, first.
HOW POWER BI COULD BRING VALUE
The same BI technologies & methods that could be adopted in a research lab are used daily in thousands of companies and dozens of industries, worldwide. By learning to leverage Power BI to improve the efficiency of their lab and science, they are learning one of the most in-demand skills in today’s job market. Combined with their scientific training, these practical BI skills will make the CV of any scientist extremely competitive, and a career in BI will be a natural progression out of academia. These individuals can then use these skills to bring value to any organization or industry of their choosing; it’s a win-win situation for both professional development and the labor market.
6. REASONABLE COST - IE PREMIUM-PER-USER $20 USD/MO./USER
In case it wasn’t clear from the above points, laboratories need to be diligent with their spending. Not only because they manage tight budgets, but also because most of the funding comes from public sources. Thankfully, however, the Power BI Premium-Per-User (PPU) offering is a modest $20 USD per person, per month. Many institutions are also already engaged in licensing agreements with Microsoft for other tools and services, so larger licensing models like premium capacity may be feasible for departmental implementations. Regardless, the potential return-of-investment here is certainly significant.
CHALLENGES TO ADOPTING POWER BI IN THIS SETTING
OK, let’s take off our rose-colored glasses for a second… what would be the challenge of implementing Power BI in a research department? Like with any big change or implementation, there are many - below I highlight what I perceive as the top 3, and how they might be mitigated:
1. CHANGE MANAGEMENT
This is arguably the #1 challenge to adopting Power BI in any organization; here, it’s particularly true. Implementing a self-service BI tool in a scientific department would mean a paradigm shift in how people use and manage both scientific and operational data. Centralizing and automating would mean that - to an extent - people lose their local ownership of data, and heightened data visibility would reveal (anti-)patterns that challenge existing departmental/lab dogmas or decisions. Further, operational or management reporting might be a concept that in some labs is entirely foreign. In an environment where these things are routine, ad hoc and often very personal, strong resistance to change is inevitable.
But that doesn’t mean it’s not impossible. Like any change, it needs to be managed. There should be a focus on the value Power BI could bring the organization and its people; how it will help. Realistically, it would also need to be done slowly and in phases, without disruption. For example, an initial roll-out might focus on the lab supply chain, an area that is usually painful and manual; it’s a low-hanging fruit in every lab. Providing first reports that automate these processes and make it easier to see the lab’s inventory and costs will help people plan their experiments and save both time and money. The interactive visuals will also trigger scientists to try Power BI for themselves to analyze their own data, building organic, bottom-up adoption momentum. Further, this will create valuable visibility for the lab decision-makers on resource costs that they didn’t have before, triggering them to think about the possibilities of other reporting.
2. GOVERNANCE
While Power BI can provide solutions to a lot of the existing data management problems in laboratories, there is a real risk that it can create new data governance issues if used incorrectly or unsupported. If the tool is left unmanaged, or training doesn’t happen, bad practices will cumulate with problematic datasets and reports. Lack of documentation will make handover or understanding existing data difficult, particularly when the inevitable turnover of PhDs or Post-Docs happens.
To mitigate this, labs - like companies - need data governance policies and practices in place. Communities of practice among users should form to share knowledge, and special persons of contact within a lab should be responsible for safeguarding data governance, to ensure the quality, auditability and trustworthiness of that labs data. If Power BI is adopted as a departmental solution, a central center of excellence could be established to ensure compliance, cultivate adoption and mentor users to drive successful adoption & use of the tool.
Arguably, investing in data governance is something labs should already be doing, to safeguard the information they produce and therefore the quality of their research. Investing in governance is thus not only a step to successfully mitigate data management risks, but itself creates value. It also brings laboratories closer to the data reality faced in the corporate world, where the tools & skills learned by scientists prepare them for life after research. Vice-versa, labs can profit from governance strategies and tools used in companies to better improve the quality and management of their information.
3. IMAGE DATA & ILLUSTRATIONS
In many labs, the bulk of the scientific data are images, such as from confocal microscopy. Power BI is built more toward handling transactional data, though reporting with images is of course still possible. This would be a technological hurdle where the broader Azure platform may help, such as Azure Blob storage. For example, pipelines could still process and analyze image data programmatically using command line interfaces, while image metadata could be stored and reported from a relational database. Initially, a lab might focus on storing quantitative information first, and inserting processed images into Power BI when they make their figures.
Ultimately, it’s important for labs to prioritize how they would leverage a platform like Power BI, implementing first for higher priority, low-hanging fruit, like operational or supply chain reporting, before tackling more specific, challenging tasks with scientific data.
TO CONCLUDE
End-to-end: What could laboratory business intelligence with Power BI look like?
SCIENCE FACES DATA CHALLENGES WHERE POWER BI CAN HELP
Innovation in Business Intelligence (BI) has resulted in tools & methods to streamline data management, use & consumption. Given the data challenges in scientific research - both with scientific and operational data - BI tools & approaches can deliver valuable, novel solutions to practical data problems. That’s not to say that there are not challenges, but as with any implementation or organizational change, these can be mitigated with careful planning, communication & execution.
To reiterate, I believe that with successful implementation of Power BI, a laboratory can…
Improve performance at scale by reporting on departmental KPIs like publications, technology transfer / IP, costs, funding, & more. This includes smarter forecasting & planning of resources.
Increase transparency & trust in how funds & data are managed with reporting
Improve data management with centralized ETL & storage in a managed cloud service
Innovate using self-service methods & interactive Power BI reports that improve understanding of research results
Automate manual data handling, allowing more time on research and less on menial tasks
Equip scientists with transferrable data skills in high demand among today’s labor markets
If we can make scientific research more efficient, more transparent, I think that’s a win for everyone.

