Solve the Right Problems
HOW TO DELIVER MORE BUSINESS VALUE
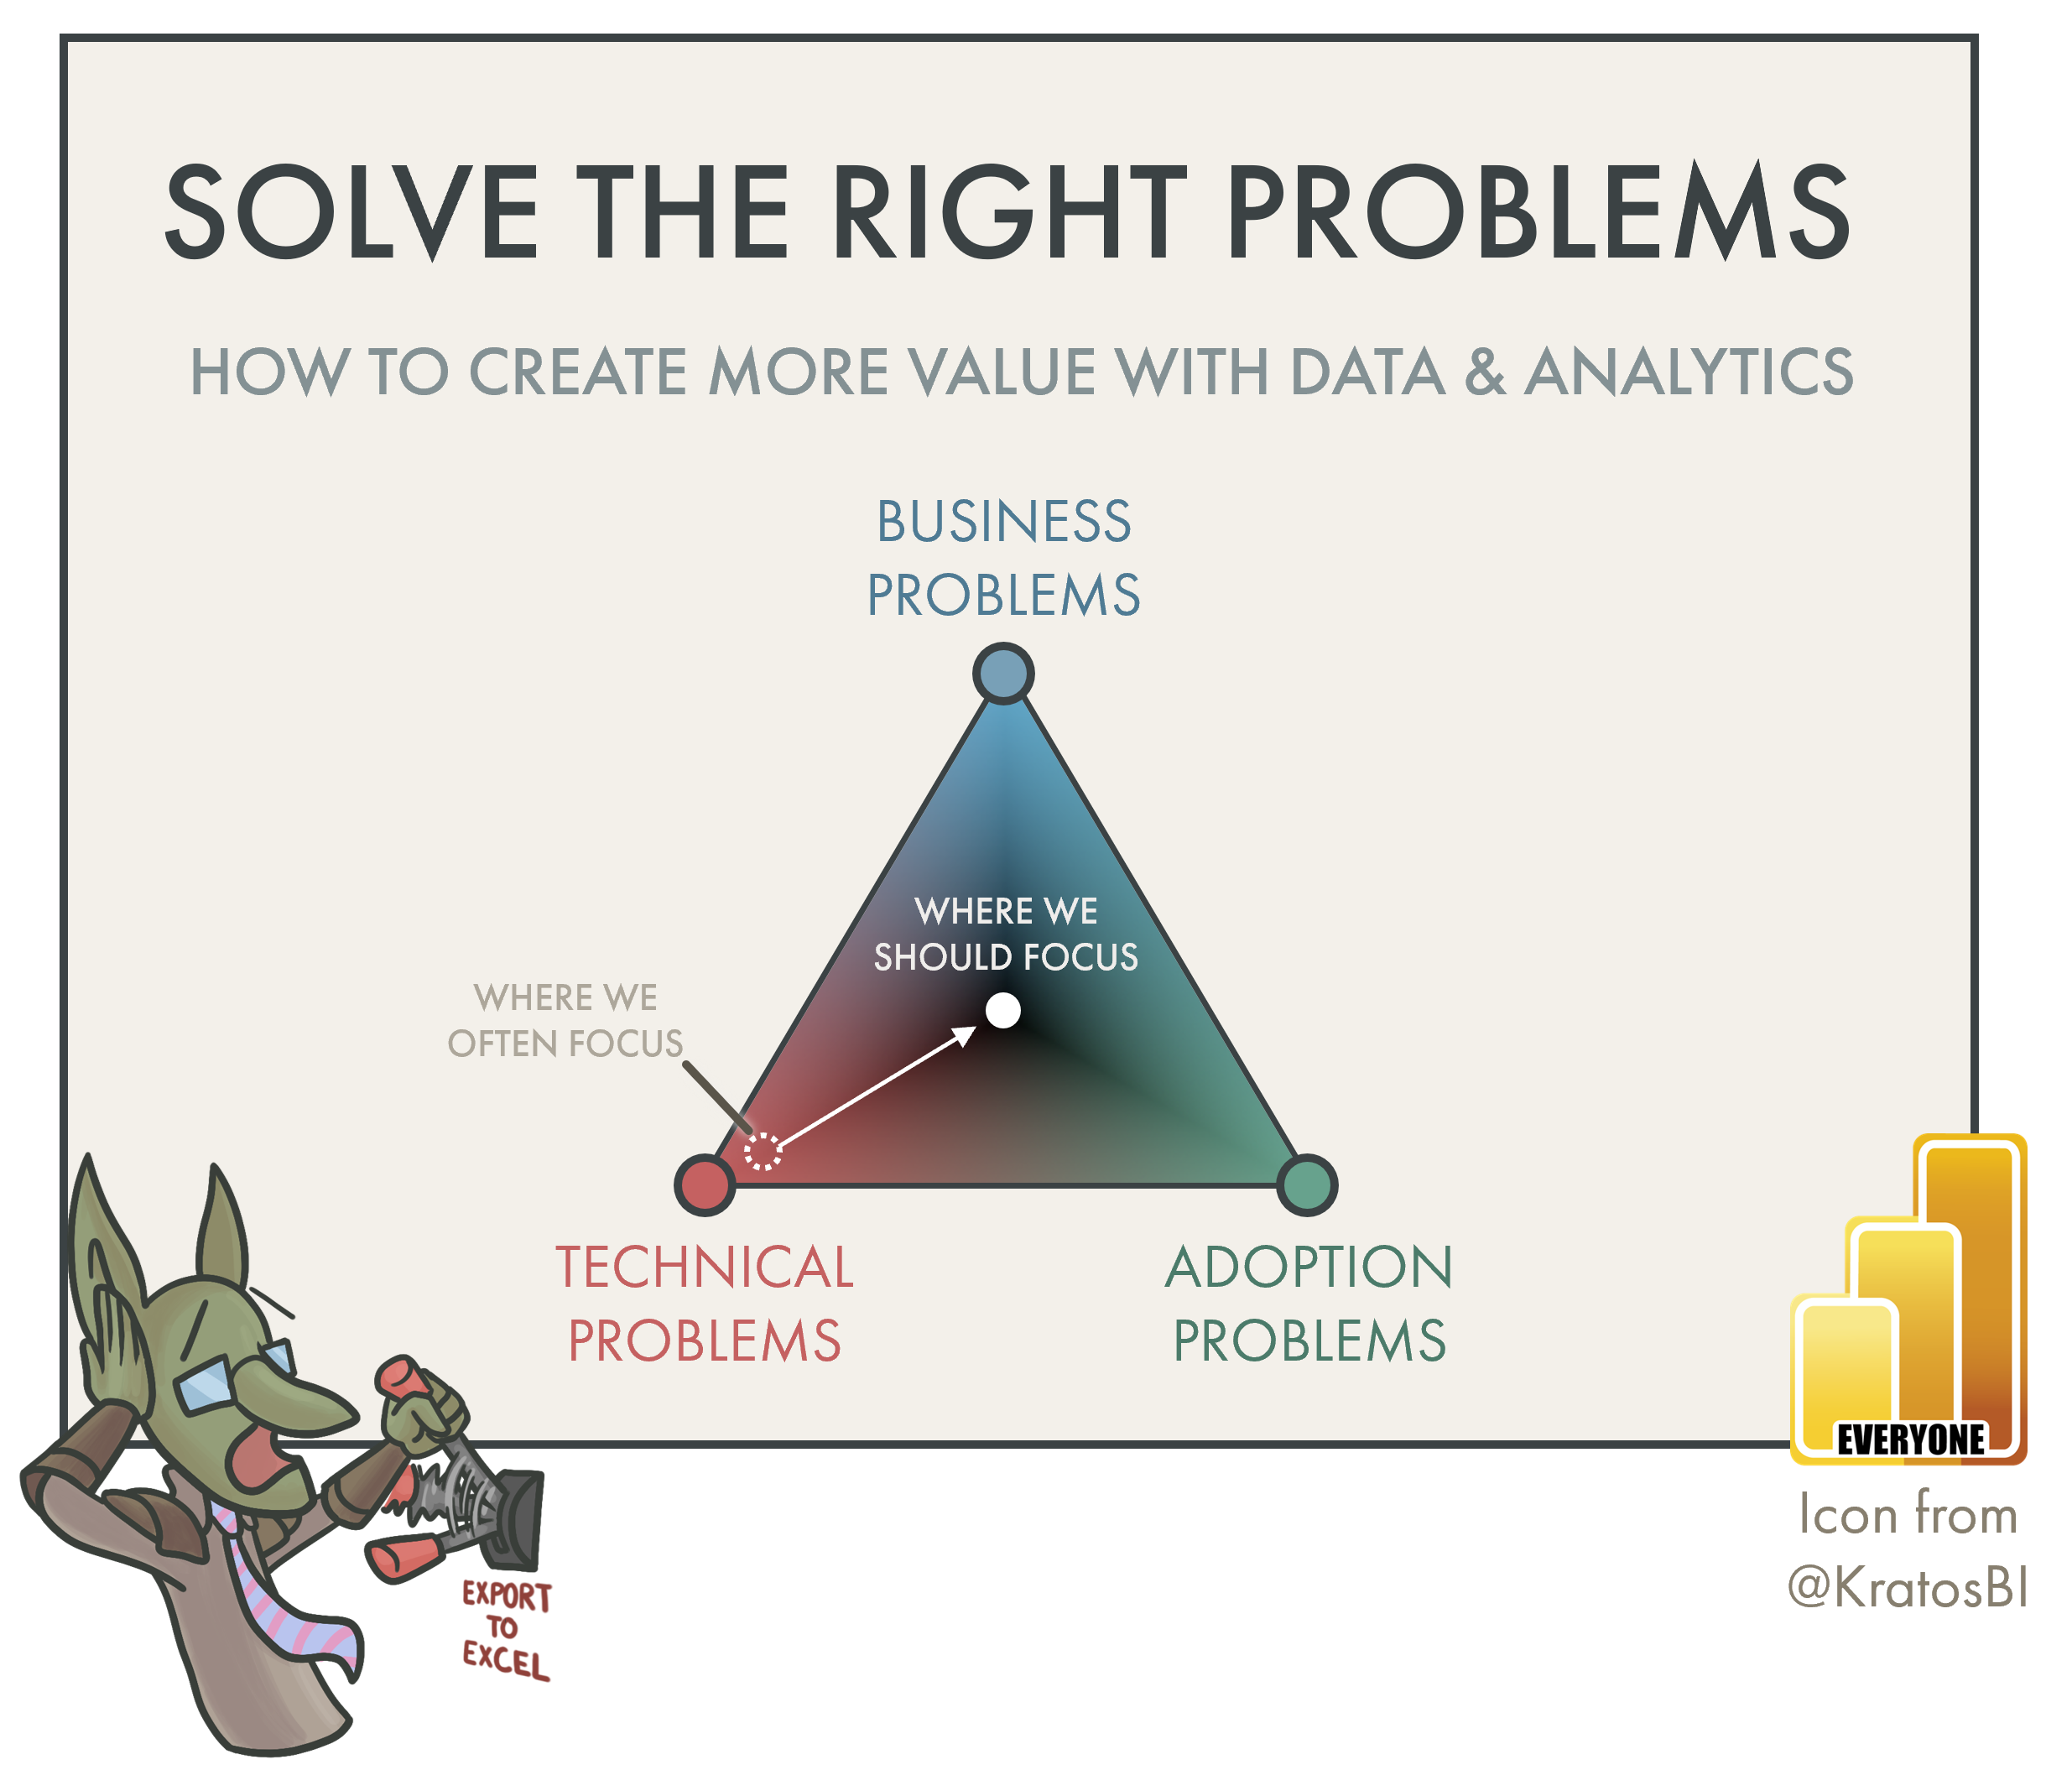
…by focusing less on technical problems to also consider business and adoption problems.
A STORY OF QUESTIONS, ANSWERS, AND EXPORT TO EXCEL

Bink was recently promoted to a new COE position
Bink the Data Goblin is a Data Analyst who supports her department by making, maintaining and helping others with Power BI solutions. Bink is quite proficient at Power BI, and is recognized in her user community as a go-to person for answers to Power BI questions. Recently, Bink was promoted to a position in their Center of Excellence to help her department make the most of Power BI.
One day, Bink receives a message on Teams from Bonk the Business Goblin. Bonk is an Analyst who works in Finance and is typically responsible for the reporting on behalf of the Finance team. Bonk asks…
“How can I automate Export to Excel?”
Bink couldn’t help but laugh; this wasn’t her first rodeo. She knows that there’s a dozen different ways to automate Excel exports. She opts for what’s typically the simplest solution in this scenario. She suggests that Bonk connect to the dataset using Analyze in Excel, or export a Live Connected Table from the report. While not explicitly an export, Bonk seems intrigued by using Analyze in Excel to get a refreshable pivot table.
It takes some time for Bonk to get Analyze in Excel working, but once he was set-up, he seemed happy, and Bink is satisfied that she could quickly solve his problem. However, it doesn’t last. A few days later, Bonk requests a meeting with Bink to discuss the same issue.
It seems that Bonk hoped this would save him time, but it didn’t. Bonk explains that he needs to prepare the Daily Summary, and e-mails different exports to about 80 different people in their department, with different data depending on their team and role. He stresses that this task is critical, but that it’s costing him too much time, and he needs to prepare and e-mail out other urgent reports. Bonk emphasizes that the data needs to be in Excel, because that’s the way people like it, and it’s easy to open and check from their inbox.
Bonk asks if there’s some smart way to use Power BI to automate the whole process; export and e-mail.
Bink is familiar with this Daily Summary report sent by e-mail. It’s been around for a while, and a lot of people use it and like it. Bink isn’t so enthusiastic about her department’s love of Export to Excel; however, their company once hired a consultant to re-make this report in Power BI… it wasn’t a hit. Actually, that’s the report that Bonk’s now exporting from.
Regardless, Bink thinks about how she can automate these exports and Bonk’s emails. She’s quite sure that Power BI Paginated Reports are perfect for this, together with a Power Automate cloud flow to automate the export and e-mail distribution of the reports in Excel. Bink writes a DAX query, creates a Paginated Report, and drafts a proof-of-concept Power Automate flow to demonstrate this solution to Bonk.
Bonk is absolutely blown away. This is exactly what he was looking for! He’s thrilled about these Paginated Reports, and asks if Bink can help him set this up for all his exports. This will save him so much time! This—together with Analyze in Excel for ad hoc export requests—will help Bonk so he can focus on making and e-mailing the many new reports requested by his stakeholders.
The meeting ends with Bonk happy and Bink satisfied that she could help. That satisfaction lasts for about five minutes, as Bonk sends her the full list of exports and reports, and all the different e-mails to be sent. Feeling a bit uneasy, Bink counts the list… 34 different export e-mails!? It’s doable I guess… Bink thinks, but there’s gotta be a better way…
CRITICALLY ASSESSING THE SITUATION
At first glance, this might seem like an allegory about managing expectations and scope, but it’s much more than that. As data professionals, we spend a lot of our time investigating and solving problems to deliver value for people in our organization. However, we have a tendency to focus on the technical aspects of problems, neglecting the business or adoption aspects of these same problems. The truth is that if we focus only on technical issues, we work with one hand tied behind our backs, and we aren’t solving root of these problems.

By enabling Bonk to continue this choo-choo train of exports, Bink is perpetuating governance and adoption issues that continue to become entrenched in the organizational data culture. These issues don’t just create inefficiencies, but real risk of exposure to data loss and mistakes. Without assessing the underlying organizational business objectives that Bonk’s trying to address, Bink can’t and won’t find the best solution for this situation.
-
When critically assessing the Paginated Report approach and the different exports, Bink realizes that there are some big flaws:
Governance risk: There are currently more than 32 Excel files being e-mailed to more than 80 different people. The organization doesn’t use sensitivity labels. Bink knows there’s a risk of data being accessed by or distributed to unauthorized individuals.
Maintenance effort: Bonk regularly updates and changes the Exports. That means either the Paginated Reports, the Power Automate Flows, or both will need to be changed, regularly, which may cost a lot of time and lead to mistakes.
Adoption and data culture issues: Bink isn’t sure this is the most effective way to consume this data. Many of the exports seem like they’re used as data sources for other, downstream uses. The reports also seem quite basic; Bink knows for sure that all this information is available from existing Power BI reports that people have access to. If they used those reports, they may not need the exports.
Ineffectively addressing business questions: Bink notices that some of the exports are using an old version of the customer and region hierarchies. Additionally, she notices some flaws in the approach to compare MTD vs. last year, because the years have different numbers of workdays (the business only operates Mon-Thurs). Bink questions how effectively these reports are really helping to address the business questions.
The characters in this story were focused on technical problems, rather than considering the wider context. Their discussions centered on how to complete a technical task - automate the exports; get the data to Excel - instead of the specific business objective to address, or how to most effectively answer these questions. While solving this technical problem was satisfying, interesting, and valuable for the individuals, it doesn’t really help the organization to achieve their objectives or advance towards their goals; “export everything” is neither valuable or helpful in the long-term, here (it rarely—if ever—is). In fact, these exports even have the potential to harm the organization by creating governance risk and endorsing an unhealthy data culture.
In this article, we go further with this scenario, and try to examine how these characters could have a higher impact and deliver more value, by addressing equally the technical, business and adoption problems.
 The purpose of this article is:
- To illustrate with images and examples how we over-focus on technical solutions to technical problems.
- To propose we as data teams and data professionals focus less on technical problems and more on technical, business, and adoption problems, together, and why this delivers more business value.
- To describe how we do this with an end-to-end example.
This is not to say that every technical problem should be overcomplicated or blown out to a bigger issue. Instead, this article discusses a general mentality shift in how we approach problems in Data & Analytics.
THE PROBLEM WITH PROBLEMS
Typically, data and analytics challenges comprise three different kinds of problems that inter-relate and overlap. You can visually illustrate this problem space as a three-way gradient between technical problems, business problems, and adoption problems; a “problem trinity”, if you will:
These three kinds of problems can be defined as follows:
- Technical problems: Challenges that relate to tools, data, technology, and their related processes. A technical problem describes a situation where something isn’t working as intended, or where a desired technical outcome can’t be achieved with the current setup. An example of a technical problem is: How can we integrate our customer hierarchies and sales data, and calculate monthly achievement for each customer?
- Business problems: Challenges that relate to business goals, objectives, and their related processes. A business problem impacts the operations, performance, or profitability of an organization. They can stem from internal inefficiencies, external factors, or strategic misalignments. An example of a business problem is: How can we create a Sales Incentive Plan to motivate our sales teams to reach their targets, this year?"
- Adoption problems: Challenges in how effectively people use tools, data, and technology to make decisions and take actions that solve business problems. An adoption problem causes the organization to not realize value from their existing tools, data, and technology. Adoption problems stem from an unhealthy data culture or a resistance to change, but also misalignments between technical and business team strategies, activities, and priorities. An example of an adoption problem is: How can we get our sales team to fully utilize the CRM and reporting tools we’ve invested in?
Most areas intersect all of these problem areas. An example is data governance. This is both a technical and adoption (people) problem, but it’s also closely tied to business objectives, such as those that relate to regulatory compliance.
To have the biggest impact in our organizations, we should focus equally on technical, business and adoption problems. Despite this fact, as data teams and professionals, we often focus too much on technical problems.
-
There are many reasons why we tend to focus more on technical problems:
Technical problems are easier to solve: When you’ve solved a technical problem, there’s usually less ambiguity. The refresh is slow or it isn’t. You either made that custom SVG visual, or you didn’t. The DAX is correct versus baseline, or it isn’t. In contrast, solutions to business and adoption problems are more nuanced and ambiguous. Often, the solutions to these problems is a continuous process with no definitive endpoint. You don’t “solve” adoption; you just work toward it. It’s hard… and sometimes, it’s exhausting. But it’s also necessary.
High urgency, low resources: Adoption and business problems require more effort or time to understand and address. When under pressure to deliver results or meet timelines, it’s easier for us to focus on “simpler” technical issues rather than “overcomplicate the task”. Unfortunately, however, the effort and resources required to tackle these many small technical problems add up over time. Furthermore, if they don’t support business objectives, or they aren’t used (adopted) by the business, then that investment has little—or no—return.
It’s our comfort zone: Most data professionals are technically trained. Few of us have formal training in concepts like change management, user experience, or stakeholder engagement. It’s uncomfortable to leave the model, the code, and the visuals to deal with issues off the screen. It’s easier for us to reject it—That’s not my job. I can’t do that.
We like it: We are more likely to solve technical problems quicker and with less ambiguity. That makes us feel good. Furthermore, for many of us, we get intrinsic satisfaction from investigating and working on technical problems. It’s not uncommon in many data teams for someone to specify that they “want to do more analysis / technical work / …”. This isn’t to say that we should be forced to do things we don’t like to do. However, we do need to accept that leaving our comfort zone is how we grow, and it’s okay to explore new things—we might even like it, over time.
We can deliver more value with data and analytics by shifting our mentality to address technical, adoption, and business problems, equally. Doing this will help us make progress towards a “data-driven” culture, support business objectives, and achieve a better balance between user enablement and risk with self-service.
So how would this work in our business case? How would our characters do this in their situation?
BINK, BONK, AND THE BUSINESS AND ADOPTION PROBLEMS
Revisiting our scenario, let’s check in with Bink. After this last discussion and agreement with Bonk, she decides to prioritize the automation of the biggest, most important exports short-term for a quick-win. Afterward, she revisits the overall situation, to critically assess what’s going on.
There’s a lot of hard questions to be answered, she realizes, as depicted in the following diagram.
The pieces of this puzzle start to become a little more clear, but it’s all still quite fuzzy for Bink. It’s complex. She realizes that she’s not going to solve this on her own, from a distance. She realizes that she’s going to have to get involved.
Bink proposes to Bonk that they work together to better understand the process and how to best support the business, while also creating a more sustainable situation for all involved. She suggests that she requests two weeks of time from her manager (resources from the COE), because she believes that understanding and addressing this situation can advance organizational goals both for BI and the business.
Bonk agrees, and they start to both engage stakeholders and investigate the data, processes, and content.
As they begin this exercise, Bink realizes that Bonk is a treasure trove of knowledge about the business, the data and the processes. Also, people in the business trust Bonk, and appreciate the efforts he’s done, so far. He’s earned a lot of credibility and respect, and rightfully so. She notes this down for later.
The pair start by trying to understand what people are actually doing with these exports. Bonk describes that some people use them as data sources, while others use them as reports. They have some short, focused calls with these stakeholders to pin down the details and illustrate the downstream lineage and use-cases in a simple way:
Bonk is quite surprised to learn that financial controllers in other regions are using his exports to make other, different reports, compiling these in PowerPoint, and mailing them out to more people (even outside their department, which isn’t allowed). He just thought people were just using this data for their own teams. Regardless, it’s clear that this isn’t the best situation. As they discuss this, Bink thinks back to the fact that much of this data already exists in the same form in Power BI.
Why aren’t these people using the Power BI reports and datasets that they have access to? Better yet…
Why are we relying on exports and PowerPoint?
One reason, she thinks, is that their organization hasn’t really invested in any change management or training for the business users. Furthermore, many of the reports are either created and shared by business users without training, or by consultants who perform a lift-and-shift, or use heavy requirements documents.
The result is that resistance to change seems rife in their culture. Many people are very attached to Excel, like the tool is a big part of their identity. In some discussions, Bink noticed people immediately became suspicious that she would “take away their Excel reports” and “force them to use Power BI”. This reaction seemed excessive, even combative to Bink.
She realizes that a revolution wasn’t going to help anyone; re-creating all these reports in Power BI and stopping the exports wouldn’t work. Instead, they needed incremental change. An evolution toward better practices, and one where trustworthy people like Bonk are both involved and enabled throughout the process.
Taking a step back, Bink works with Bonk to try and pinpoint the specific business objectives that these exports and Excel reports are trying to address.
What insights should they deliver?
What objectives do these support?
How does this advance the high-level, strategic organizational goals?
Interestingly, the exports and reports seemed to focus on two main goals: sales effectiveness and profit optimization. To make progress toward these goals, executive leadership defined some annual targets that they want to reach. They use these exports and reports to:
Track progress toward these targets
Estimate whether they will meet their targets throughout the period
Identify areas of under- and over-performance for key decisions and actions
Bink reiterates that all of this data already exists in Power BI; they have sales and profitability reports. So why aren’t they being used?
Why are the Power BI reports not being used?
Well, there seem to be many reasons. Generally, the sentiment is that “Power BI is an executive reporting tool” and “it doesn’t have the detail we need”. Bink knows for a fact that the data in the Excel files is nearly identical as what’s in Power BI (it comes from the Power BI dataset, after all).
However, Bink notes that the Financial controllers do add key cost information to properly calculate the margin. This data - while limited - is lacking from their Data Lakehouse. Additionally, she notes that some calculations are missing, but would be easy to add to the existing dataset as DAX measures.
It also seems like the reports are poorly designed to deliver what people need. They are either full pages of cards, or what the users call “BATs” (big-ass tables — Bonk excitedly points out they’re great for exporting). None of them follow best practices, and the users weren’t involved in the requirements gathering or design process.
Furthermore, people were never trained to use Power BI. They don’t know how to use cross-filtering, filters, drill-down, and drill-through to get this detail, themselves. Furthermore, they just don’t know where to find anything in Power BI; reports are spread across multiple workspaces with no clear or consistent structure and layout.
Finally, there was just no change management or adoption actions taken when their organization implemented Power BI. Some teams saw it as a threat to their existing activities, and didn’t want to invest time and effort in learning a new tool when they could just keep using the Excel files they were e-mailed every day. Explaining and justifying the change - and aligning it to the way people work - could go a long way.
So now the full breadth of the situation is clear to Bink. But now what? What does she do with this information?
INCREMENTAL PROGRESS TOWARD A BETTER SITUATION
Together with Bonk, the COE, and some key stakeholders, Bink comes up with a plan.
Bonk would take over the dataset and reports: Bonk’s valuable business knowledge and credibility made him the perfect candidate to take ownership of this solution. Bink would mentor and train Bonk to learn Power BI, managing the proposed dataset changes and reports alongside him, then gradually phasing out as he incrementally took on more and more ownership and responsibility. Once he was fully in the lead, he could always fall back on COE support for specific, complex issues.
Key changes to the dataset and reports: Bink and Bonk would collaborate with the stakeholders to identify incremental improvements to the dataset and reports. For example, data security would be implemented to ensure that people only see data according to the organizational compliance and regulations. In the meantime, Bonk could continue the exports in parallel to avoid disruption and enable testing and validation. However, these exports would be phased out in stages as the reports were rolled out. They proposed three tiers of reports progressing from overview to more detail, based on their understanding of the business data needs.
User training and change management: The executive sponsor of Power BI for the organization would communicate this plan to the users, and stress the strategic importance of Power BI for their business. Thereafter, Bonk and Bink would organize weekly Power BI trainings and feedback moments. Bink would lead these to start, but Bonk would also incrementally take greater leadership as he became comfortable. Specific training actions for key users like the Finance controllers could enable them to make their own reports with Analyze-in-Excel, while still preserving data security. To get this access, they needed to first sign an accountability agreement, where they agreed to not distribute the data. Worth noting, this exercise made the organization realize the need for Data Loss Prevention (DLP) could no longer be ignored, so they were also debating a proof-of-concept to test sensitivity labels and DLP policies.
Governance and monitoring: The COE outlines clear, concise data governance policies, and Bink sets up a simple solution to monitor usage and outliers like excessive export to Excel. This auditing and monitoring could enable some simple actions to mitigate risk and also track adoption.
This plan wouldn’t revolutionize their department’s efficiency or the data culture, overnight. But that wasn’t the point, or the goal. Instead, it gave them a clear roadmap for evolution of their data culture to a healthier, more sustainable and effective destination. Instead of continuing the exports to avoid disruption and change, some targeted investments and focus helped identify key weaknesses and opportunities for improvement, and work in a way that better aligned their BI and business strategies.
Furthermore, the improved solutions might better answer data questions, and better enable people to achieve their business objectives.
FROM SITUATIONS TO STRATEGY: HOW DOES THIS SCALE?
The approach outlined above fits a specific anecdote to make the concepts concrete and easier to understand. But how does this scale? How can we shift this focus on beyond single situations and teams?
The answer is that we need to define a BI strategy. To do this, what you need is G.O.B.L.I.N.S.
The above image is just a preview — for more on BI Strategy… stay tuned! 😉🎯
Goblin Tip:
A planned future series all about BI Strategy is in the works as part of the Power BI Implementation Planning. The Power BI Implementation Planning articles provide helpful, concrete guidance for Power BI.
I'm contributing to the Power BI Adoption Roadmap and the Power BI Implementation Planning, which is why I've been posting fewer articles, here. Make sure you check out this guidance documentation, today! It's super helpful, and super important!

TO CONCLUDE
Challenges in data and analytics involve technical, business and adoption problems. However, as data professionals, we tend to focus more on technical issues. By evolving our mentality to equally consider technical, business and adoption problems, we can deliver more value and have higher impact with our activities and solutions.
This isn’t to say that we should expand every technical issue. Rather, we can simply critically appraise the situations and challenges we face in our organizations in a broader sense to better identify how we can best and most sustainably enable people to achieve their business objectives.