


Track Changes in Power BI: Part 5 - Using pbi-tools
AUTOMATING POWER BI REPORT SOURCE CONTROL
…using pbi-tools and Power Automate
pbi-tools is a command-line tool that enables Source / Version Control of Power BI (thin) reports and datasets. In this article, we look at some tips to best use pbi-tools and how to automate pbi-tools execution in the background, using Power Automate Desktop flows, or leverage the powerful “watch” functionality recently added in pbi-tools, itself.


Example of report source control - visual container that has moved position in a report section (page)
An important note if you are using Sensitivity Labels - files with Sensitivity Labels are currently not supported with pbi-tools.
CONTENTS
Parts 1-3: Source Control for Power BI Datasets using Tabular Editor
Part 4-6: Source Control for Power BI Reports using pbi-tools
Tutorial: Using pbi-tools for Source Control of thin reports
(Part 6 - April 12, 2022) Extending the output: Additional use-cases for pbi-tools.
IN THE PREVIOUS POST
Source Control / Version Control is needed for Reports as well as Datsets
pbi-tools is an open-source, external tool that enables Source Control of “thin” reports
pbi-tools extracts pbix contents, i.e. themes, images & a deserialized layout structure
These contents can also be accessed manually by changing the extension to .zip
Accessing pbix contents this way is not possible if sensitivity labels are used
TUTORIAL: PBI-TOOLS FOR SOURCE CONTROL
Getting started with pbi-tools
Starting with pbi-tools is easy. What you need:
Source Control repository (Azure DevOps Repo, Github or other)
An SCM tool or CLI (Azure Data Studio, Visual Studio, Git GUI/CLI, etc.)
Latest release of pbi-tools (follow instructions in this tutorial to get set up; make sure you complete the optional step to add to your path)
A .pbix file to test with - the pbi-tools tutorial recommends the AdventureWorks sample pbix from Microsoft, if you don’t want to use your own.
(Optional for later parts of the article) Power Automate Desktop installation
Once you’re set up, all you have to do is to run the below code in the command prompt or PowerShell terminal, replacing the paths with your own directories. The output directory should be in the repository you are using for source control. You should specify a folder that does not exist; I prefer the name of the report being extracted.
NOTE
Make sure that if you are using the -extractFolder argument, the subsequent string is a new folder. If it’s an existing folder, the tool will irrecoverably delete the contents of the existing directory and replace it with the pbi-tools output…

If it worked correctly, you should see a terminal output similar to this.

The output of the tool will be an extraction of report contents
The pbi-tools output - Source Control of the Report Layout structure
How you should use pbi-tools:
Work in Power BI desktop to make a ‘set’ of changes
Run pbi-tools
Observe & commit the changes in SCM, following your own process appropriately
Once you’ve been using it, you may notice that the Report Layout Structure is not so obvious; some changes are easy to understand (i.e. coordinates of visualContainers (visuals), but others are not. Below are some tips you should follow to make the Report Layout Structure legible and organized:
The first time you commit the report to source control, ensure it’s representative of the ‘default’:
This will make sure that even small changes (like whether the filter pane is expanded/collapsed, or default slicer values) will be picked up in source control. This includes things like report settings.Give your visuals (and pages) identifiable names:
The visual titles are used to create the deserialized files in visualObjects.Group your report changes before running pbi-tools:
This will allow you to stage your changes in semantically organized groups for good, clear documentation.Always order your visuals and pages in a logical way:
This is a good practice anyway, but ensure the z-layout (i.e. what is front/back) and tab order of the visuals are set, intentionally. Tab order is particularly important for report accessibility. These are easily done with the ‘selection’ pane.Ensure that the report interactions are set intentionally:
Visual interactions are particularly difficult to identify and read/understand in the report layout structure. If you change these, it’s worthwhile spending effort checking how this changes the Report Layout Structure, so you can recognize the changes and what they mean.
AUTOMATING REPORT SOURCE CONTROL
While implementing pbi-tools in my report workflow manually is already helpful, I wanted to see if I could run pbi-tools automatically whenever I saved a .pbix. That way, I could see what changes were made in that development session, without doing anything other than the work in Power BI Desktop.
This can be set up in Azure DevOps Pipelines, of course, but I wanted to see whether I could execute pbi-tools using Power Automate.
The Sample Report
For this test, I used a hobby report that I recently made, which visualizes statistics scraped in near-real-time from a Minecraft server.
This was done as a PoC to build a Power BI solution on real-time game server data. If there’s interest, I can write a separate post about how to do this.
Automating source control - Power Automate
It turns out, it’s pretty easy to automate this using Power Automate. The only thing noteworthy to mention is that the connector between Power Automate and Power Automate Desktop is Premium. Below is an overview of how it works:

1. A Power Automate Cloud flow detects if a file was created or modified in a SharePoint folder.
A) This is connected to a Power Automate Desktop flow, which receives the dynamic variables & passes them to the PowerShell script.
B) This SharePoint folder is where I save all my .pbix thin reports, synchronized to the cloud automatically.
Power Automate Cloud flow connected to the PAD flow which detects any modified .pbix files
The cloud flow has 3 variables that are used in the downstream Power Automate Desktop flow:
I. filename: The name of the .pbix file that was modified or created (with extension)
II. path: The path to the .pbix file in the SharePoint site
III. outpath: The path where I want the output saved; my source control repo with a dynamic sub-directory of the report name.
2. A Power Automate Desktop flow which runs the dynamic PowerShell script for pbi-tools on the saved report.
(A) The pbi-tools output is dynamically a folder of the report name in my source control repo
(B) The .pbix is copied to this folder after the script is executed, for documentation purposes
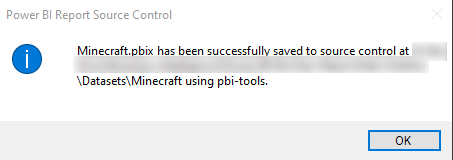
(C) A message is displayed notifying the source control operation completed
Power Automate Desktop flow to automate execution of pbi-tools in response to the cloud flow
This results in the below workflow:

The pbix is saved, synchronizes with SharePoint and triggers the flows
The PAD flow executes pbi-tools and notifies me when it’s done
I’m working on a .pbix report, and make specific changes
I save & close the report, which synchronizes to SharePoint
This triggers the cloud flow, which passes some parameters about the .pbix to the PAD flow
The PAD flow is triggered, which runs pbi-tools
I’m notified, and only the changes I made in that session are visible in SCM
I write a commit message, and proceed with the normal PR process.
This way, pbi-tools runs in the background whenever I modify a report. In principal, we could further extend this using the methods demonstrated on Azure DevOps for CI/CD; running build, test & deployment.
The change are visible in source control

Write a commit message for that session and commit / push the changes, when ready
Automating source control - pbi-tools watch
One recently added feature of pbi-tools also enables this, but does require you to first work in the CLI:

In the terminal, you can use pbi-tools to get the Process ID of any open Power BI sessions
Entering this as an argument together with -watch will enable a ‘tracking changes’ mode
Whenever the .pbix is saved, pbi-tools automatically extracts the changes
You can then commit these changes as above.
This is extremely handy and simple, as it requires no extra set-up.
Interpreting the changes on the Report Layout Structure
One way I’ve been using this feature is to explore what different report changes do to the source code. For example, in one report, I changed the default slicer value from “# Blocks Mined” to “# Mobs killed” (it’s a Minecraft report).
This resulted in the expected change in the Report Layout Structure for the slicer object:
Changing the default slicer value is visible in the Report Layout Structure
However, this also resulted in changes of the Report Layout Structure elsewhere that I did not expect. These changes happened the next time I saved the report, although I had only changed whether the filter pane was expanded by default. My suspicion is that this has to do with visual interactions, but truthfully, I don’t yet know; why would it change when the only 2 changes I made were a default slicer value of 1 slicer and expanding/collapsing the filter?
This was particularly interesting since the prior values were null — it’s interesting to dive into this further with test cases.
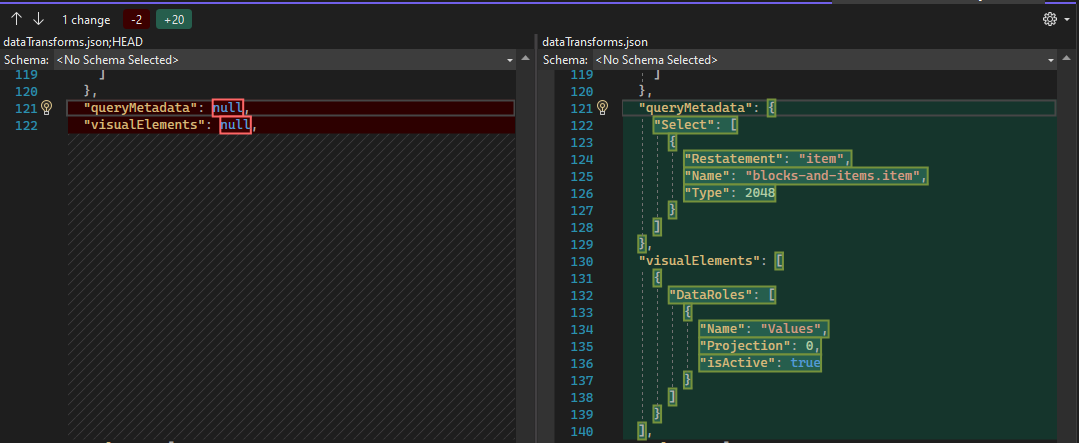
Other changes are visible in source control which are hard to explain or understand
Clearly, there’s a lot we have yet to learn about the contents of the Report Layout Structure, and what they mean. I’ve started a to document each key/value combination, and to produce a json tree to map it. I use this for work in Python to handle & parse this file.
The doc is not done but is also not a priority — I’ll share it in the coming weeks, when it’s ready:
WIP documentation of the Report/Layout file
The pbi-tools extract -watch method was recently presented by Mathias Thierbach at the Des Moines Power BI UG, which was recorded & you can watch, on their YouTube channel:
TO CONCLUDE
It’s easy to get started with pbi-tools for source control, but it’s hard to interpret the changes to the report layout structure. Over time, we will better understand the contents of this file.
Report source control with pbi-tools can be automated in a variety of ways
Deployment of reports with pbi-tools can also be done & automated, if desired, for CI/CD


