


What Microsoft Fabric means for your semantic models: Scenario 3
ONE TEAM’S SEMANTIC MODEL
…an example of a scenario where an enterprise BI team goes from Power BI Premium to Fabric Capacity
This article is part of a series: What Microsoft Fabric means for your semantic models.
Scenario 3: Enterprise team (this article).
In Fabric—like Power BI—you make different choices to build and use your semantic model in different ways. Various factors will motivate your decision to use one feature or approach over another.
In this article, I highlight one example of a scenario where a team goes from using Power BI to Fabric, and have made specific choices to support their needs and their way-of-working. Specifically, this is a centralized IT or BI team, who have struggled to scale using the tools available in Power BI until now, and hope that the enterprise features of Fabric will help them better build and manage larger models, at scale.

 The purpose of this article is twofold:
1. To demonstrate an example of how a team's workflow changes from Power BI only to Fabric.
2. To demonstrate Direct Lake storage mode in Fabric for semantic models.
3. To discuss different ways to manage the lifecycle of your semantic model with Fabric's features.
⚠️ This article is not a deep-dive into Direct Lake storage mode.
This article is intended to be informative; I'm not trying to sell you Fabric, nor am I endorsing a tool, feature, or approach.
VIDEO ARTICLE
The video version of this article series is available in several videos which you can find here.
SCENARIO 3: BEFORE FABRIC

This team are a centralized IT team who manage Power BI for their organization and deliver sets of centralized content via models and reports. They are responsible for various data and BI projects (and tools) throughout the organization, and not just Power BI. Their Power BI implementation is still in its infancy; they’ve been using Power BI for about 18 months.
Despite this recent implementation, the team has had success to establish a workflow that is structured and reasonably automated. Currently, this team makes use of external tools like Tabular Editor to create and manage their models, and uses Power BI Desktop to create reports. They have multiple developers who collaborate on content, so they commit and push their changes to Azure Repos Git repositories scoped to specific projects. In Azure DevOps, they orchestrate the lifecycle management and deployment of their content by trying to achieve CI/CD.
From DevOps, they deploy this content by using the Tabular Editor CLI with XMLA Endpoints (for models) and Power BI REST APIs (for report .pbix files) by using Azure Pipelines. They have different pipelines for validation (of only models, where they use the Best Practice Analyzer) and for deployment to workspaces. They deploy to four different stages: development, test, pre-production, and production. In pre-production, they try to conduct concurrency and performance testing of their validated models and reports. Once deployed to production, they manage access to models so that self-service creators can use them for their own analyses.
On paper, this team already has a very sophisticated and mature workflow to develop and deploy Power BI content. However, in practice, they struggle in many different areas.
SCENARIO DIAGRAM: BEFORE FABRIC

This diagram reflects the structured approach that this team takes to develop and manage Power BI content in their organization, today. However, they have several pain points that make it difficult for them to scale their models and overall approach to managing and deploying content.
Their import models take too long to refresh. This team deals with data volumes and complexity that are much higher than average. Their models are very large, and they need to put special effort and care into managing these models and ensuring that their models and Power Query are performant. They perform little to no transformations in Power Query, yet the daily refresh of their models still take a long time.
The team also struggle with DirectQuery. Some reports have higher demands for data freshness. Specifically, each distribution center has dashboards that show the current open orders for that warehouse, and other metrics about the open orders that aid the order picking and fulfillment process. While not quite real-time, the data is updated multiple times an hour, requiring that the team use a DirectQuery model. However, the performance of these DirectQuery models are suboptimal and result in slow reports and a poor expeirence for end-users.
They have difficulty to scale their processes. This team has a structured and mature process to manage content from Azure DevOps. However, they find these pipelines complex and difficult to maintain. Furthermore, they struggle to collaborate effectively, and regularly have issues with merging changes and resolving conflicts. They have no visibility on changes made in report .pbix files, and the .bim format is suboptimal for this way of working (although for their biggest projects some team members already use the Tabular Editor database.json format).
With their move to Fabric, the Power BI developers on this team hope that they will be able to better scale and manage their enterprise content. They’re most interested in Git integration, but as we’ll see, they also will get a lot of value from both Direct Lake storage format and notebooks.
SCENARIO 3: AFTER FABRIC
With Fabric, this team have a simpler, yet more robust workflow.
SCENARIO DIAGRAM: AFTER FABRIC

Goblin tip:
Git integration isn't supported with Direct Lake models. However, it did work in February 2024 when I made these demos. So while it doesn't work yet anymore (it was a bug that it worked at all, apparently), you can see how it looks in the below video.
Goblin tip:
This team could have also used TMDL and .pbip files before they moved to Fabric. Saving models to TMDL format or saving .pbix files as .pbip aren't features limited to Fabric.
There are several significant changes in how this team builds and manages their semantic models.
NOTEBOOKS

Like in Scenario 1 and Scenario 2, this team has discovered the power and potential of notebooks in Fabric. In this third scenario, this team places notebooks in separate workspaces based on their scope and use-case; the notebooks are segregated from Power BI content.
These notebooks allow this team to not only transform their data sources, but also to programmatically manage tasks, items, and usage of their Fabric environment. For instance, this team uses notebooks to gather data from the Fabric REST APIs and activity log to place in OneLake for their custom monitoring solution.
Furthermore, this team has set up additional automated testing for their semantic models by using semantic link. This automated testing validates against specific expectations and test conditions that they design beforehand, and helps them ensure that their semantic model and the underlying data are fit for use before refreshing import models and reframing Direct Lake models.
DIRECT LAKE
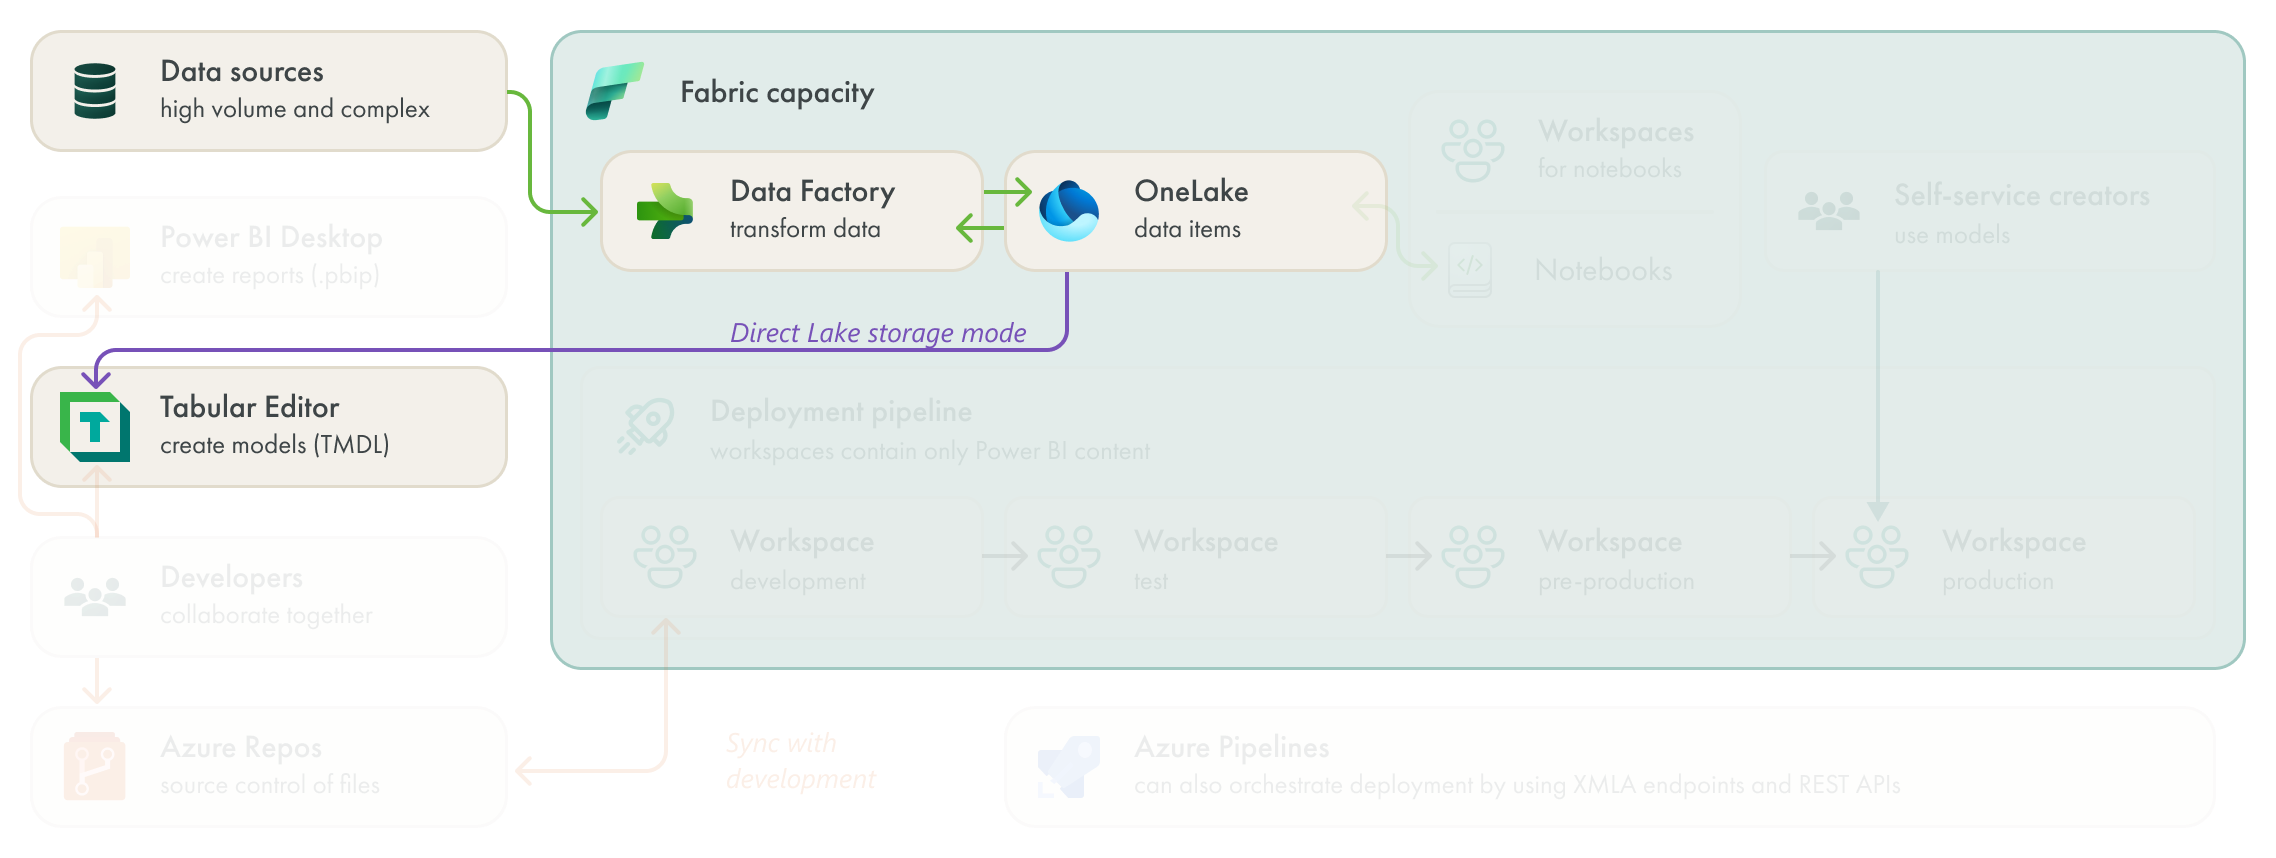
The team centralized their data in OneLake. This lets them use Direct Lake storage mode in many of their semantic models. The team decides to continue using Tabular Editor to build and manage Direct Lake models by managing model metadata in the TMDL format. The team in this scenario chose for Tabular Editor to manage their Direct Lake models for the following reasons:
They have access to additional properties and features that aren’t yet supported by Power BI Desktop or the user interface in the Fabric portal, like creating Field Parameters or using Git integration.
They can disable case-sensitive collation for models set to “DirectLakeOnly” fallback behavior.
They can re-use their existing library of DAX and C# scripts that they used to manage their previous models.
They can use the built-in VertiPaq Analyzer and Best Practice Analyzer in Tabular Editor to validate their models while they work. This is particularly helpful to validate relationship cardinality and integrity.
Direct lake provides this team the following benefits:
For their import models, this helps them avoid the long refresh times.
For DirectQuery models, they experience much better query performance with Direct Lake.
However, Direct Lake has some considerations that this team are still wrapping their heads around:
Fallback to DirectQuery: The team decides to disable DirectQuery fallback by setting the fallback behavior to Direct Lake only. However, their queries fail when the fallback would occur, so the team invests effort into more performance testing, both in their model and their DAX, as well as in the underlying delta tables. This performance testing and maintenance is more sophisticated than what the team is used to dealing with in their import models, so they are admittedly struggling here, a bit.
Framing of new data: The team decide to not have OneLake data changes automatically be reflected in their semantic model. Instead, they refresh—or “re-frame” the model—when validation notebooks complete. This ensures that the model references the appropriate OneLake files, but only once the data is correct and the team is sure there won’t be any unpleasant surprises.
In general, Direct Lake is providing this team a lot of value. Although, they do decide to keep their mid-size to small import models as import storage mode, for now.
GIT INTEGRATION
Like in the second scenario, this team intends to make use of Fabric Git integration. This team has now pivoted to using Power BI Projects (.pbip) files instead of Power BI Desktop (.pbix) files for reports, and TMDL files instead of .bim files for their models. These features aren’t new to Fabric, and this team could have used these file formats with Power BI Premium. However, they must use these formats if they want to use Git integration.
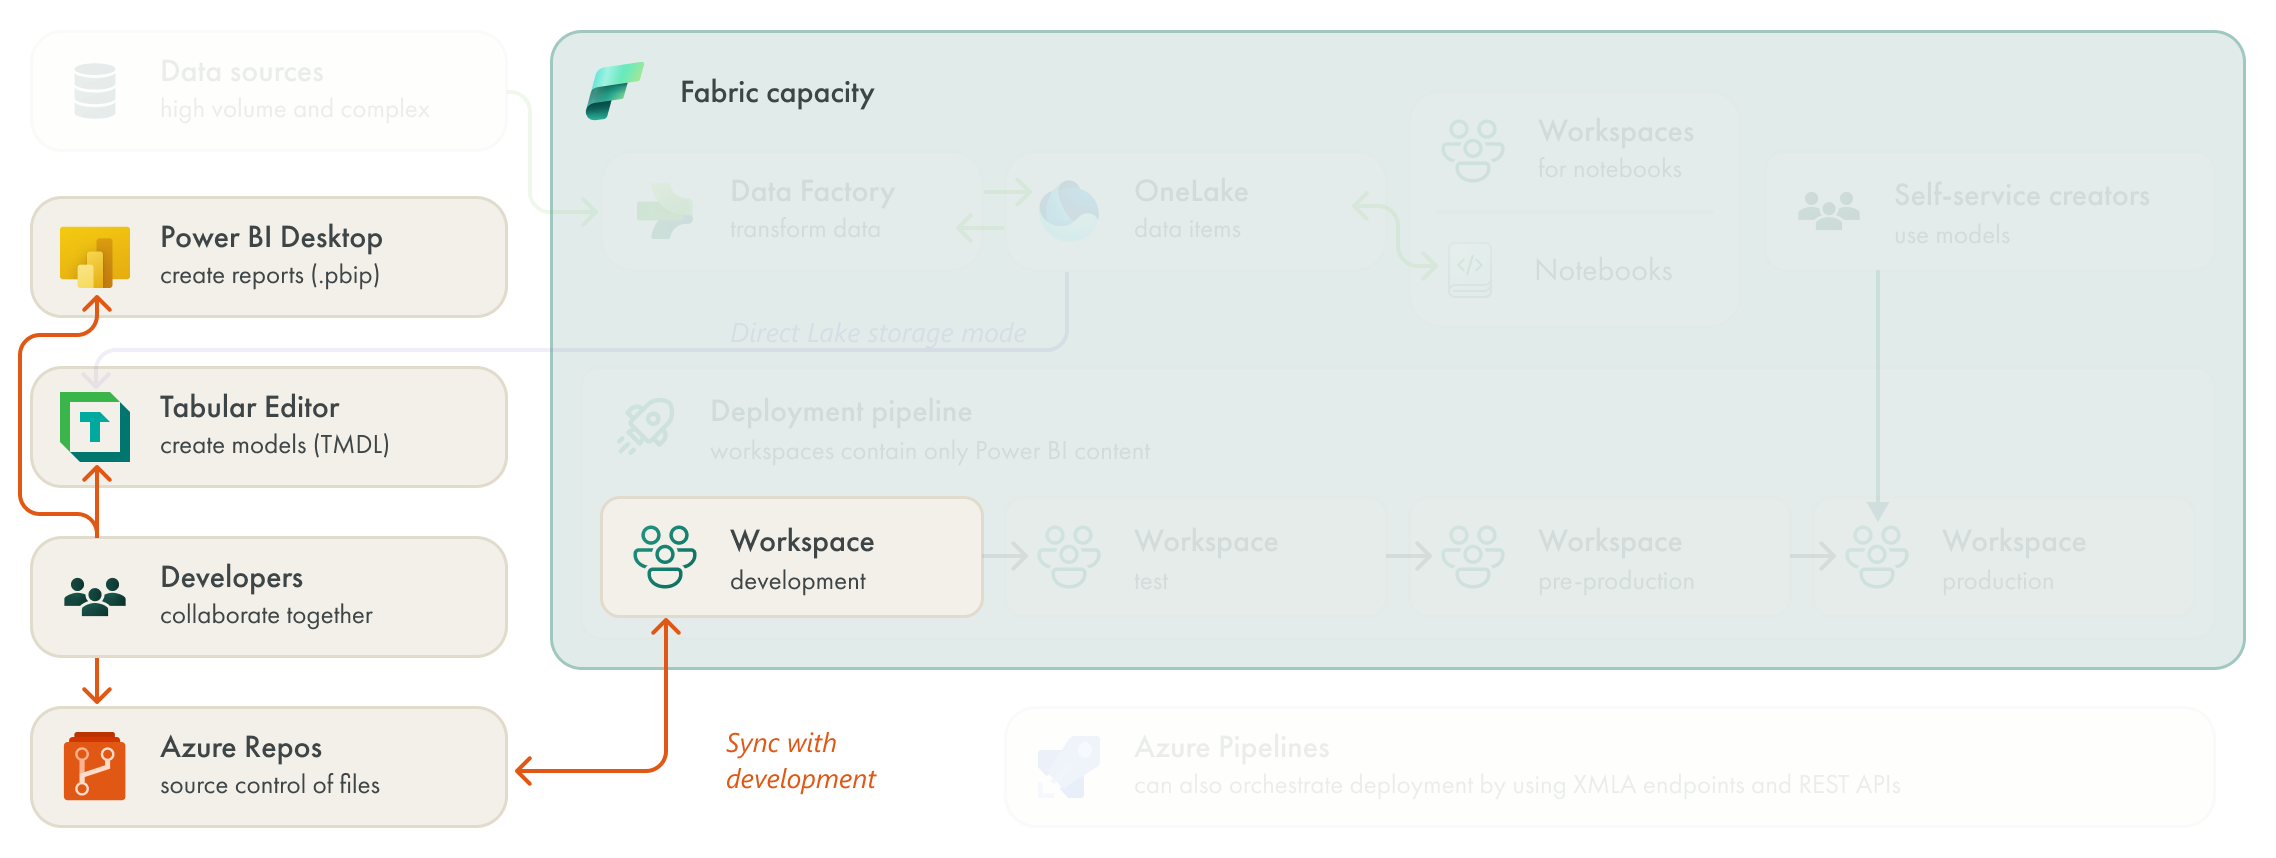
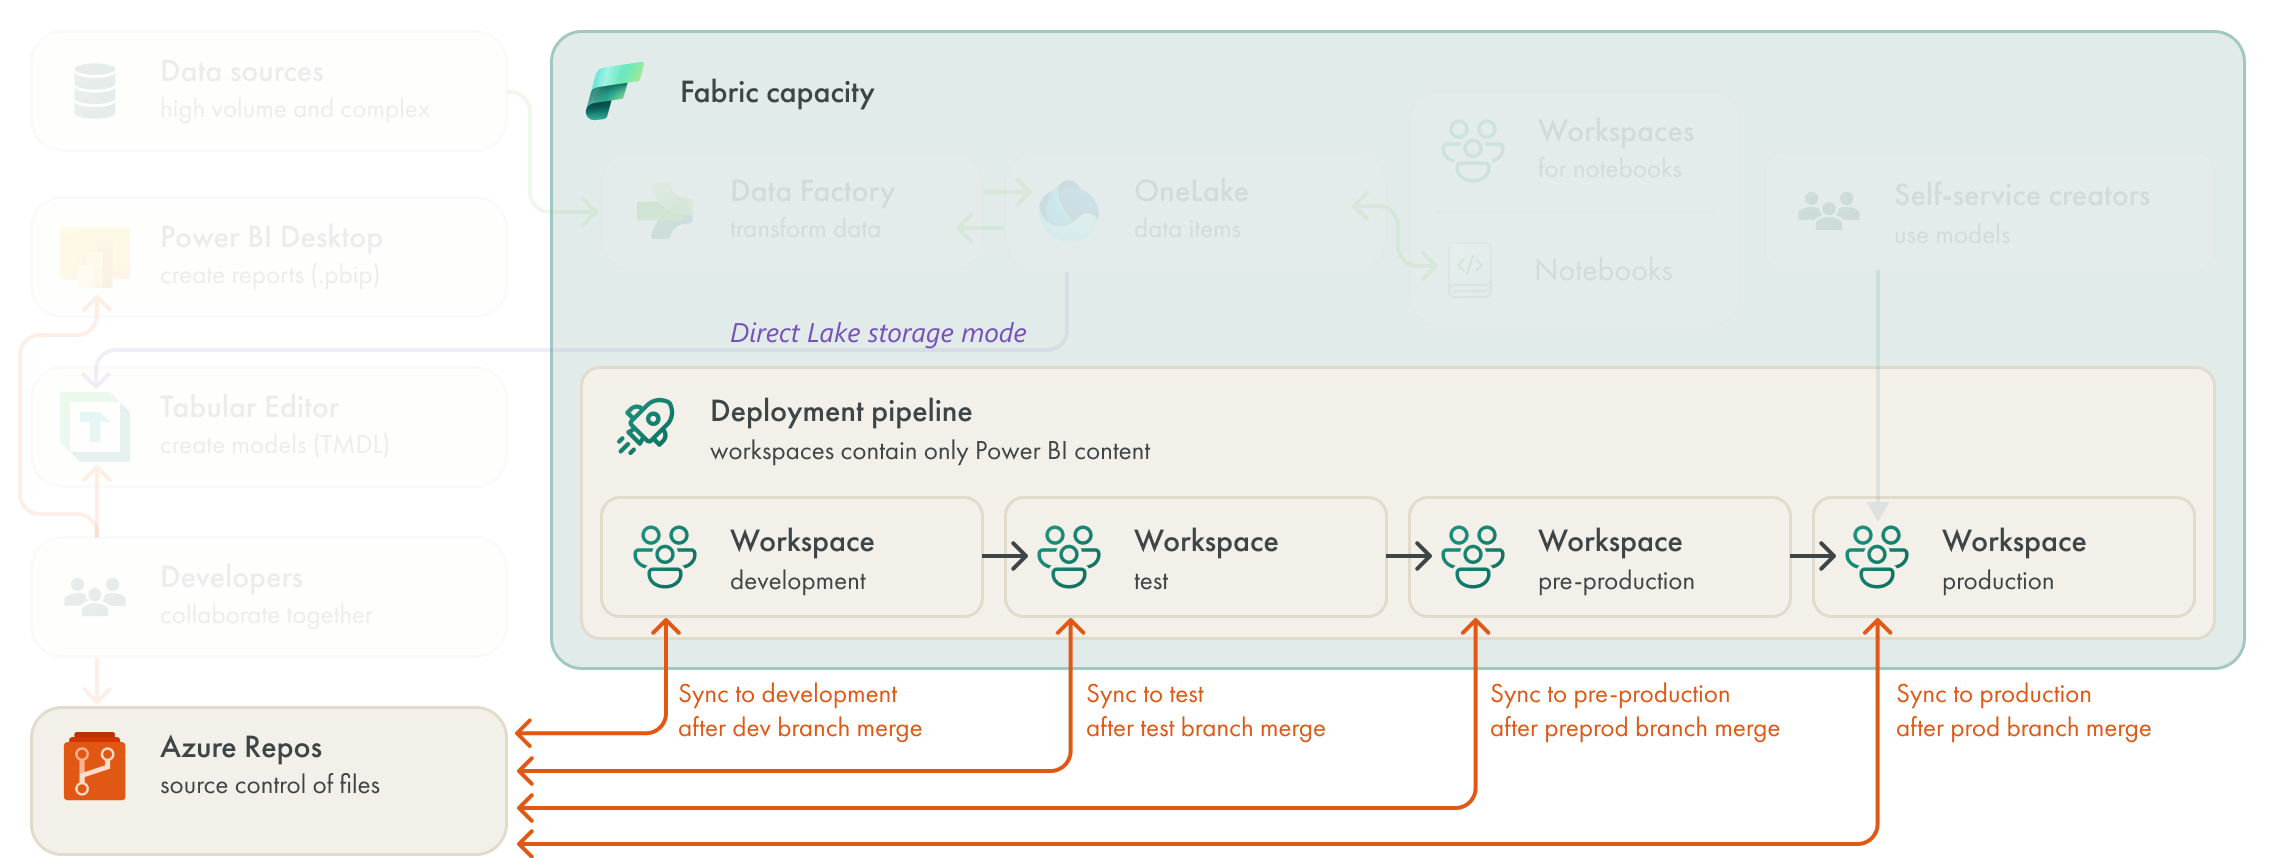
This team already has a straightforward branching strategy in place, which they adapt to use with Fabric Git integration, as depicted below:

To summarize:
Models and reports are synchronized with the development workspace in an initial commit.
Developers make branches from the main branch to develop features or fix bugs.
Developers work in either Power BI Desktop (for .pbip files) or Tabular Editor (for TMDL files).
Developers sync their branch to a private workspace to validate changes. They make regular commits to their branches, using .gitignore and .gitattributes files, where appropriate.
When ready, developers submit a pull request (PR) to merge their branch into main. Any merge conflicts are resolved before the PR can be accepted and the content can be merged.
When their PR is accepted, the changes are merged and the developers’ branches are deleted.
After being merged, the content is synchronized with the development workspace so that changes are visible. After this, content can move through the deployment pipeline as usual to later stages.
DEPLOYMENT PIPELINES
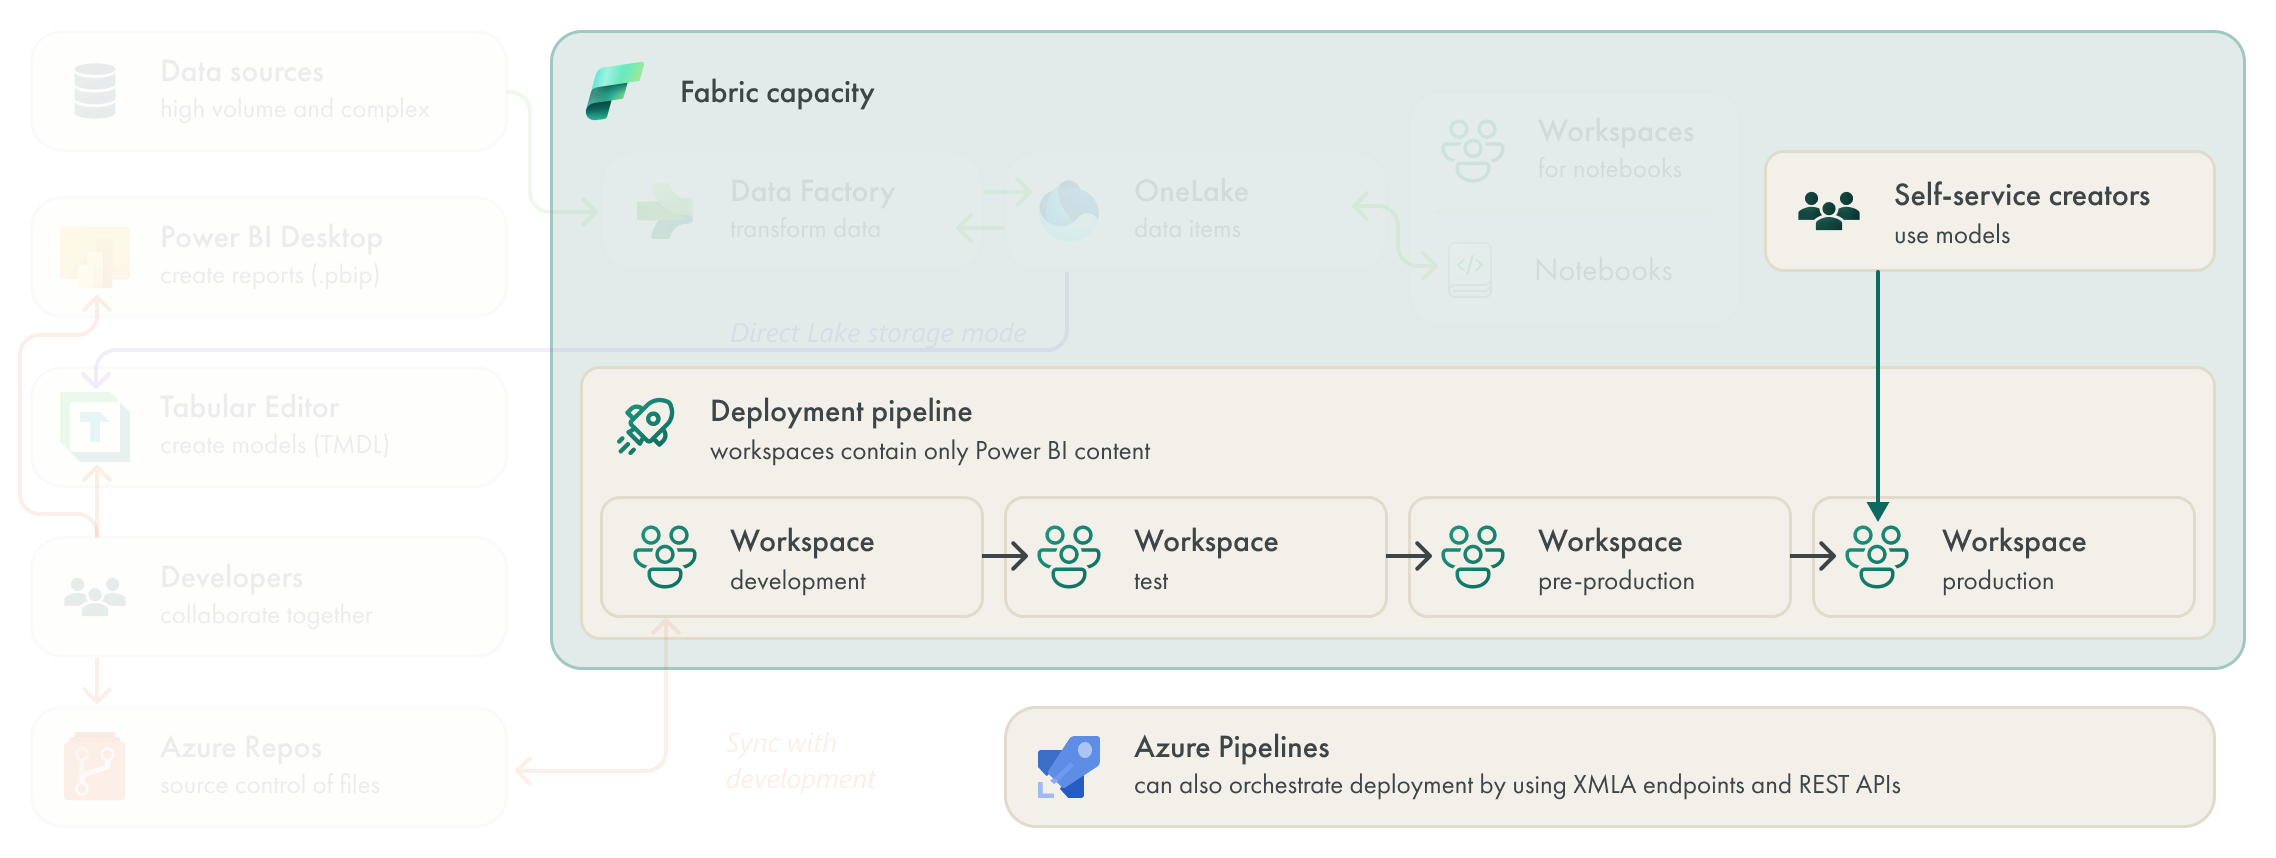
The team had access to deployment pipelines in Power BI Premium, already. However, they elected not to use them in favor of centrally orchestrating deployment from Azure DevOps. Now that they’re using Fabric Git integration, which synchronizes their models to the development workspace, they decided a better fit would be to use simplified Azure Pipelines to control deployment pipelines.
The Azure Pipelines now don’t deploy content from the repo, but rather trigger the deployment pipeline to move content through to additional stages. They also automate most post-deployment activities by using these Azure Pipelines together with the Power BI REST APIs. Some activities are still manual, like updating the Power BI apps that are linked to test or production workspaces.
In general, the deployment process is a bit more simplified compared to their previous situation. However, some team members preferred to have everything for deployment centralized in DevOps, rather than relying on deployment pipelines. The team is currently exploring an alternative approach to deployment, wherin each workspace synchronizes with another branch. In this approach, “deployment” occurs when a PR is accepted and the content is merged, so merging would indirectly control the deployment. This approach is depicted below.

TO CONCLUDE
In this third and final scenario, an enterprise team shifts from Power BI Premium to Fabric so that they can benefit from the various enterprise features to build and manage semantic models. Specifically, they get good value from notebooks, Direct Lake storage mode, and the various lifecycle management features of Fabric. They use these features in combination with other tools that they’re already familiar with and used for other Power BI solutions. These tools include Tabular Editor, VS Code, and the different Azure DevOps services.
However, this team does have some new considerations to keep in mind. For instance, they need to consider how to manage Direct Lake performance with respect to fallback behavior and when data has been paged out of memory. Given the expanded scope of Fabric, this team also needs to now invest more time and resources into auditing and monitoring, particularly with their cost and CU utilization.

