


A Beginner's Guide to Tabular Editor 3: UI Customization & Code Assist Features
Tabular Editor (TE) is a powerful, high-quality, external tool for Power BI & AS Tabular Models that helps you make better models more effectively. In the below article, I introduce how to navigate & customize the UI, as well as provide an overview of some key features that will boost your productivity.
This post is part 3 of a weekly series about Tabular Editor (TE). Part 2 about TE licenses is here.
1. Finding your way around Tabular Editor 3
The first time you open Tabular Editor 3, you will see a default layout similar to the below.
A standard menu bar to select and modify the various properties and functions
A customizable icon toolbar for the main functionality
A customizable workspace consisting of rearrangeable windows for the many TE3 features
The default layout & toolbars in Tabular Editor 3
It’s a very clean, elegant layout, but there is a lot to unpack, especially if you are “migrating” from Tabular Editor 2. Below I give a whirlwind tour of the various features in Tabular Editor 3, briefly mentioning what they do and why they are useful. Future articles will dive more in-depth to use-cases and tutorials of how to use these features.
So where can you find all these exciting new features? For example, how do you customize the user interface?
2. Customizing the UI in Tabular Editor 3
Customize the theme of Tabular Editor
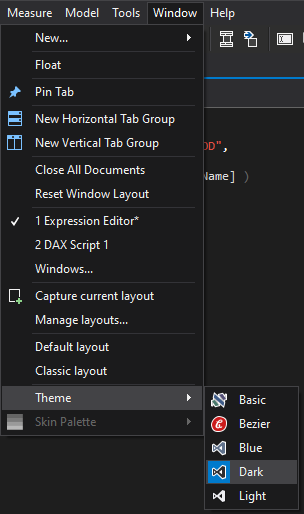
Change the theme in Tabular Editor 3
Tabular editor has a lot of options to personalize layouts and themes. From the “Window” menu there are a lot of options to customize the UI in Tabular Editor. The first I’ll draw your attention to is at the bottom - changing the theme. I’m not sure how common this is, but the first thing I do with any application is try to change the appearance or theme to Dark Mode. Obviously! C’mon, gotta save your eyes. 👀
But actually, Tabular Editor 3 has a surprising amount of flexibility when it comes to customizing the theme. Personally, I prefer ‘Office Dark’, which you can select when choosing “Bezier” and adjusting the “Skin Palette”. There are a lot of options, though, so you can pick whatever works best for you, tweaking it a bit further, if you want.
In all of my tutorials and screenshots, I use the ‘Office Dark’ palette. Try a few of them for yourself and find one that works for you!

The many colours of Tabular Editor seen from the “Skin Palette” menu when selecting “Bezier” theme
Customizing window & toolbar layouts
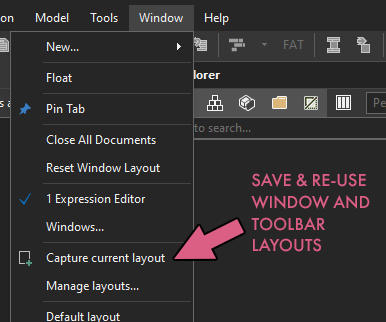
Capture, save & re-use window/toolbar layouts
The default layout of TE3 is quite similar to the one of TE2. However, unlike TE2, you can rearrange the windows however you like. Not just sizes & dimensions, but also the position, including making the windows float and repositioning them about your screen separately. You can also close windows you don’t frequently use or need, or add ones that are hidden by default. Once you find a layout you need, you can save and re-use it, later!

Don’t be overwhelmed! Rearrange elements to fit your needs
Why it’s useful: This is more than an aesthetic frill. Being able to rearrange your windows is not only important from an accessibility point-of-view, but also helps you set up a productive workspace in the tool. After you have been using TE3 for a few weeks, it’s recommended that you take some time to create & capture some layouts that help you be efficient. Some examples below:
Find & Replace window (hidden by default) to be always visible
Separate layouts for developing my own models vs. exploring / troubleshooting second-hand models made by other people.
Removing toolbar icons where I preferentially use keyboard shortcuts
Opening DAX Query or C# Script windows in a separate, floating window
Other customization options: toolbars, commands & options
From the Tools menu there are some other UI customization options for the toolbars. You can add or remove tool icons and groups of icons, or make TE icons larger for accessibility. Other commands - for example saving window layouts - can be dragged into the toolbar, as well. This can even be done with context-independent macros (i.e. that run over the entire model, all measures, etc.). For example, a macro that formats all DAX in your model can be added to the toolbar for ease-of-use!
So when it comes to customization and flexibility of the Tabular Editor 3 UI, it’s clear that there’s a lot to offer, here. It’s recommended that you spend some time on this, to create a layout that works for you.
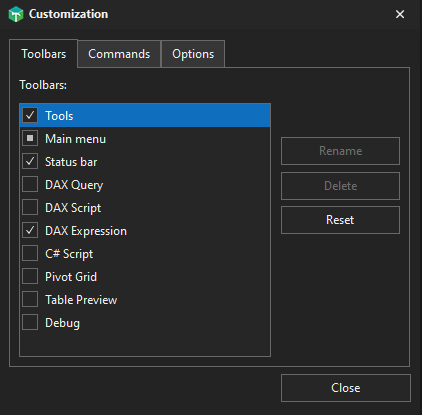
Toolbar customization in Tabular Editor 3
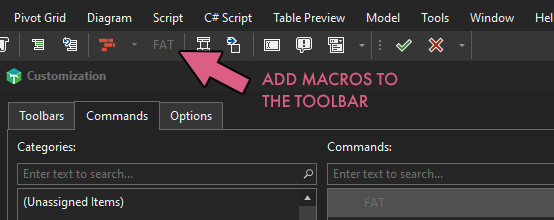
You can add custom C# macros to the toolbar
Diving into the Main Menu
3A. A reference of save file formats in Tabular Editor
Opening & Saving Files / Models

Connect to your models
From the menu bar you may find the standard options & preferences. For example, the first thing you likely want to do is connect to or open an existing model. This is easily done from the small cube icon in the toolbar, or from the File menu, where you can also open DAX / C# scripts or models from the various save formats supported by Tabular Editor.
To connect to a local model, you need to either have the file in a supported format (like .bim, saved from TE2) or connect to a model local instance of Azure AS, which happens when you open Power BI Desktop on your machine.
For a remote model, you need to connect to a supported service. For Power BI, this only works with Premium capacities supporting XMLA endpoint connection (Premium Capacity, Premium-Per User).
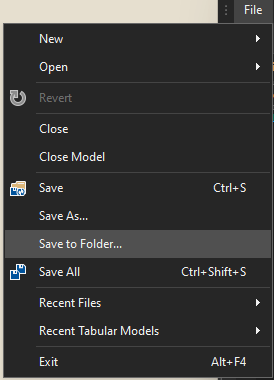
Note the “Save to Folder…” option
File Menu & Save Formats
As mentioned, from here you can open or save existing models in supported formats, as well as scripts (C#, DAX & M) and queries (DAX). The supported formats are detailed below:
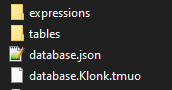
TE Folder Structure
.bim format: Analysis services model metadata format. This is a semi-structured .json file describing the model, its objects, and their respective properties in a human-readable format. When saving your data model as a .bim file, you capture the overall structure of the model and object definitions, but save nothing
database.json & TE Folder Structure: The preferred way of saving & working with your model, the TE folder structure serializes your model, separating & organizing the objects into distinct .json files and (sub) directories. This is very handy for source control, which I have written about here. The database.json file is a .json file containing TE settings information and descriptive information of the model, such as:
Basic info: Model name, guid & compatibility level (a 4-digit number describing the ‘version’ of the model)
Model annotations: For example, if auto date/time is enabled (__PBI_TimeIntelligenceEnabled) and the order of the Power Query queries.
When & how it was saved to the folder structure from Tabular Editor (and by which user)
Power Query groups* (folders), orders & names of queries therein.
*NOTE that to my knowledge, Power Query folders (queryGroups) are not viewable or editable from the Tabular Editor UI of TE2 or TE3. Thus if you copy an expression from one model to another in TE, and that query is located in a query group, it will produce an error when attempting evaluation, which you can’t resolve from the TE UI itself, to my knowledge. You will need to edit this database.json to remove the query group before copying the query, or add it in to the new model’s definition.
In the directory of the folder structure, you will also find the below:
Folders for each object group (i.e. tables, expressions) with each individual object therein as a .json file (i.e. a specific measure). Individual objects have their properties all inside the definition.
database.User.tmuo: If you are using TE3 in Workspace Mode (simultaneously connecting to the model both on desk & in the service), the .tmuo file will also be present. This file contains user settings and Workspace Mode information. The file is otherwise empty if there are no specific settings, or Workspace Mode is not used.
.pbit format: The Power BI template file format contains model metadata, allowing it to be loaded into Tabular Editor (unlike .pbix files). This is actually not supported by Microsoft, so it isn’t a recommended file format for working with your model.
Note that this file format isn’t supported in TE3: Desktop.
.vpax format: This format saves the results and summary statistics of your model when analyzed by the VertiPaq Analyzer. This file is created by other tools integrated with VertiPaq Analyzer, i.e. to compare models before/after optimizations or to see how the model statistics have been evolving. It’s more an analytical format than a working format for your model.
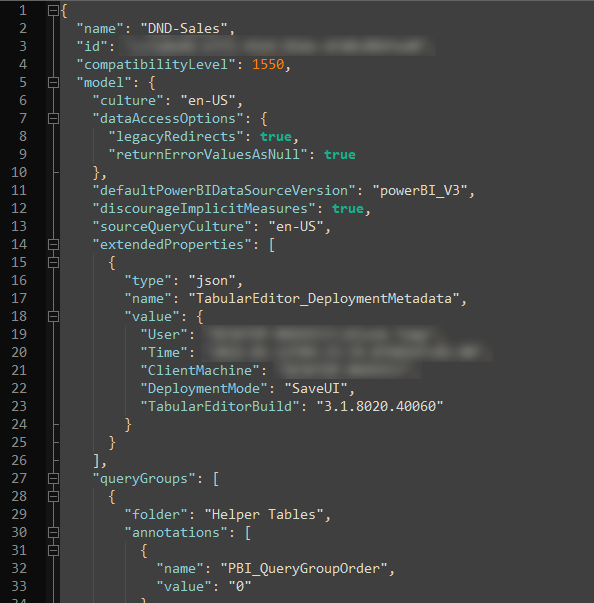
Example of a database.json file
Now that you know how to navigate the TE3 UI and open & save your model in various formats, it’s time to take a look at the various features that will help you be more productive!
3B. Code Assist features
Find & Replace in Tabular Editor 3
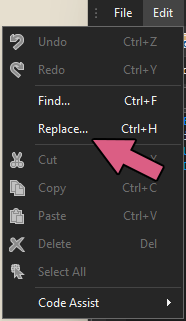
Note the “Find…” & “Replace…”
Looking in the Edit menu, we see the expected options for undo/redo and copy/paste, as well as the Find/Replace option, which lets you search your model, or Find/Replace in open documents & expressions. This can be a huge time saver when modifying existing code in repetitive ways. Note that - as mentioned above - the Find/Replace window can be docked in the workspace layout, so it’s easily accessible for searching your model.
Code Assist features in Tabular Editor 3
You’re probably noticing the menu for Code Assist. Herein you find context-sensitive functionality to help author DAX code (and M, C#, to a lesser extent). These options will be enabled when using the Expression Editor or authoring DAX Queries.
One of the biggest boons to productivity in Tabular Editor are these plethora of code assist features for aiding DAX coding. A few of these features (like commenting/uncommenting code) work also with M expressions and C# scripts. Below I give a brief overview of each of these features, how to use them and why they are valuable for your productivity.
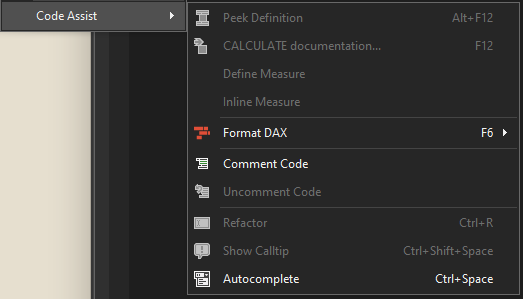
Code Assist menu in ‘Edit > Code Assist…’
Peek Definition (Alt + F12):

“Peek Definition” - open a window-in-window to “peek” the definition of a measure (OTD% in this case)
When it can be used: When authoring DAX code, if your cursor is on a calculated object, or when right-clicking the object.
What it does: ‘Peek Definition’ for that object to check the underlying expression. This opens a “window-in-window” to view the code, which can be closed with ESC.
Why it’s helpful: When authoring complex expressions with inter-dependent / nested code, it’s needed to check what you’re referencing now-and-then. Peeking instead of opening a new expression window can - in the long-run - save a lot of time.
…Documentation (F12; ‘Go to Definition’):
When it can be used: When authoring DAX code, if your cursor is on a DAX function, or when right-clicking the function.
What it does: Navigates to a dax.guide webpage entry for it.
Why it’s helpful: Early on in your DAX journey, you will need to frequently check examples or documentation of functions to understand how to best use them or write code. For example, this is handy for checking quickly optional arguments or expected datatypes.
When it can be used (2): If you’re selecting a model object (i.e. a normal column or table) or right-clicking the object.
What it does: This will snap to the object in the TOM explorer, so you can check the properties or home table, for example.
Why it’s helpful: Like “Peek Definition”, complex expressions may require frequently checking other objects. You might need to check an object’s properties - Data Type or Format String, for example- or see if a table has security (RLS, OLS) rules active.
Define Measure (No keyboard shortcut):

Defines upstream the measure
When it can be used: When writing a DAX Query and the cursor is on a measure, or right-clicking the measure.
What it does: Defines the measure expression at the top of the query (similar to ‘Script DAX’). If you have used DAX Studio before, you will be familiar with this functionality.
Why it’s helpful: When debugging, testing and optimizing DAX code, defining the measure upstream of the query will let you make small changes without having to modify the measure object expression and save these changes to the database.
Inline Measure (No keyboard shortcut):
When it can be used: Same as Define Measure
What it does: Replaces the selected measure with its expression.

Replaces the [# Invoices] measure with it’s expression
Why it’s helpful: There are cases when iterating DAX code, one may with to use the underlying expression rather than a measure reference. This is because a measure always is wrapped in an implicit CALCULATE statement.
Format DAX (Long-line: F6; Short-line: Shift+F6):
When it can be used: When a DAX expression is in the primary window.
What it does: Formats the DAX code either with Long-Line formatting or Short Line formatting using daxformatter.com from sqlbi.
Why it’s helpful: If it’s not formatted, it’s not DAX. Formatted DAX code is essential to maintain readability & elegance of the code in your model. What’s even more powerful, you can leverage this functionality in C# scripts to format all objects at once. So, there’s no excuse to not format your DAX!
Comment/Uncomment Code (No keyboard shortcut):
When it can be used: When the cursor is in any expression editor or query window (including DAX, M, C#)
What it does: Comments out the line by inserting two forward slashes (//) or dashes (—), depending on the setting in the “Tools > Preferences…” menu. This deactivates the specific line. “Uncommenting” removes these inserted characters.
Why it’s helpful: Instead of deleting code, it’s often preferable to comment out lines or parts you want to remove. Then, if you want to add it back, you just have to “uncomment” the code. Additionally, it’s commonplace to use comments to document the steps in the code for other developers (and your future self). This is a good practice, both for governance as well as learning code (DAX, M, C#).
Refactor (CTRL + R):
Replacing or removing all DAX variables at once
When it can be used: When the cursor is on a DAX variable, or when right-clicking the variable.
What it does: Initiates a “Rename Variable” mode, where all variables with the same name change if you alter one of them. You have to press ESC to back out of this mode, and press ENTER to submit your changes if you just one to change or delete of the variables in the code, for example.
Why it’s helpful: An alternative to “Find/Replace”, this can be an elegant way to gain some extra time, efficiently replacing, removing or re-naming variables in a DAX expression.
Show Calltip (CTRL + SHIFT + SPACE):

Calltip for SUMX, when highlighted for the first argument
When it can be used: When the cursor is on or inside of a recognized DAX function (i.e. when the cursor is on a specific argument, or when right-clicking it).
What it does: Shows a summary of the required arguments of the function with a brief description, including key tags like ITERATOR or CONTEXT TRANSITION.
Why it’s helpful: This is extremely helpful - especially for DAX beginners - to understand the code. For example, what parts of the code are affecting your evaluation context, or to know where an iteration is occurring. This callout tooltip also appears when authoring code and is an extremely effective way to be informed on what a function is doing, and what is needed for it to work properly.
Autocomplete (CTRL + Space):
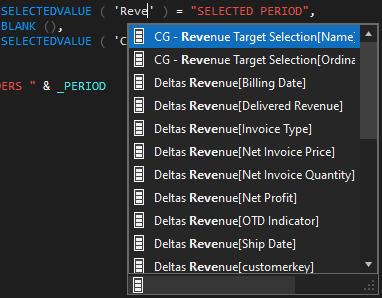
The Tabular Editor 3 Autocomplete menu
When it can be used: When typing an object from the model.
What it does: Brings up the Autocomplete menu, from which you can select an element to enter at the cursor’s current position using Tab or Enter.
Why it’s helpful: This is a matter of preference but can help you to type code faster, particularly when objects have long or ambiguous names (which is hopefully not the case 😉 )
3C. Overview of main windows in Tabular Editor 3
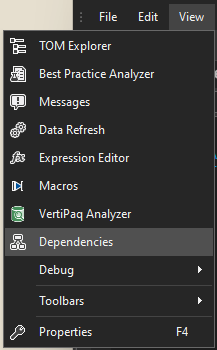
Note the “Dependencies” & “Debug” windows
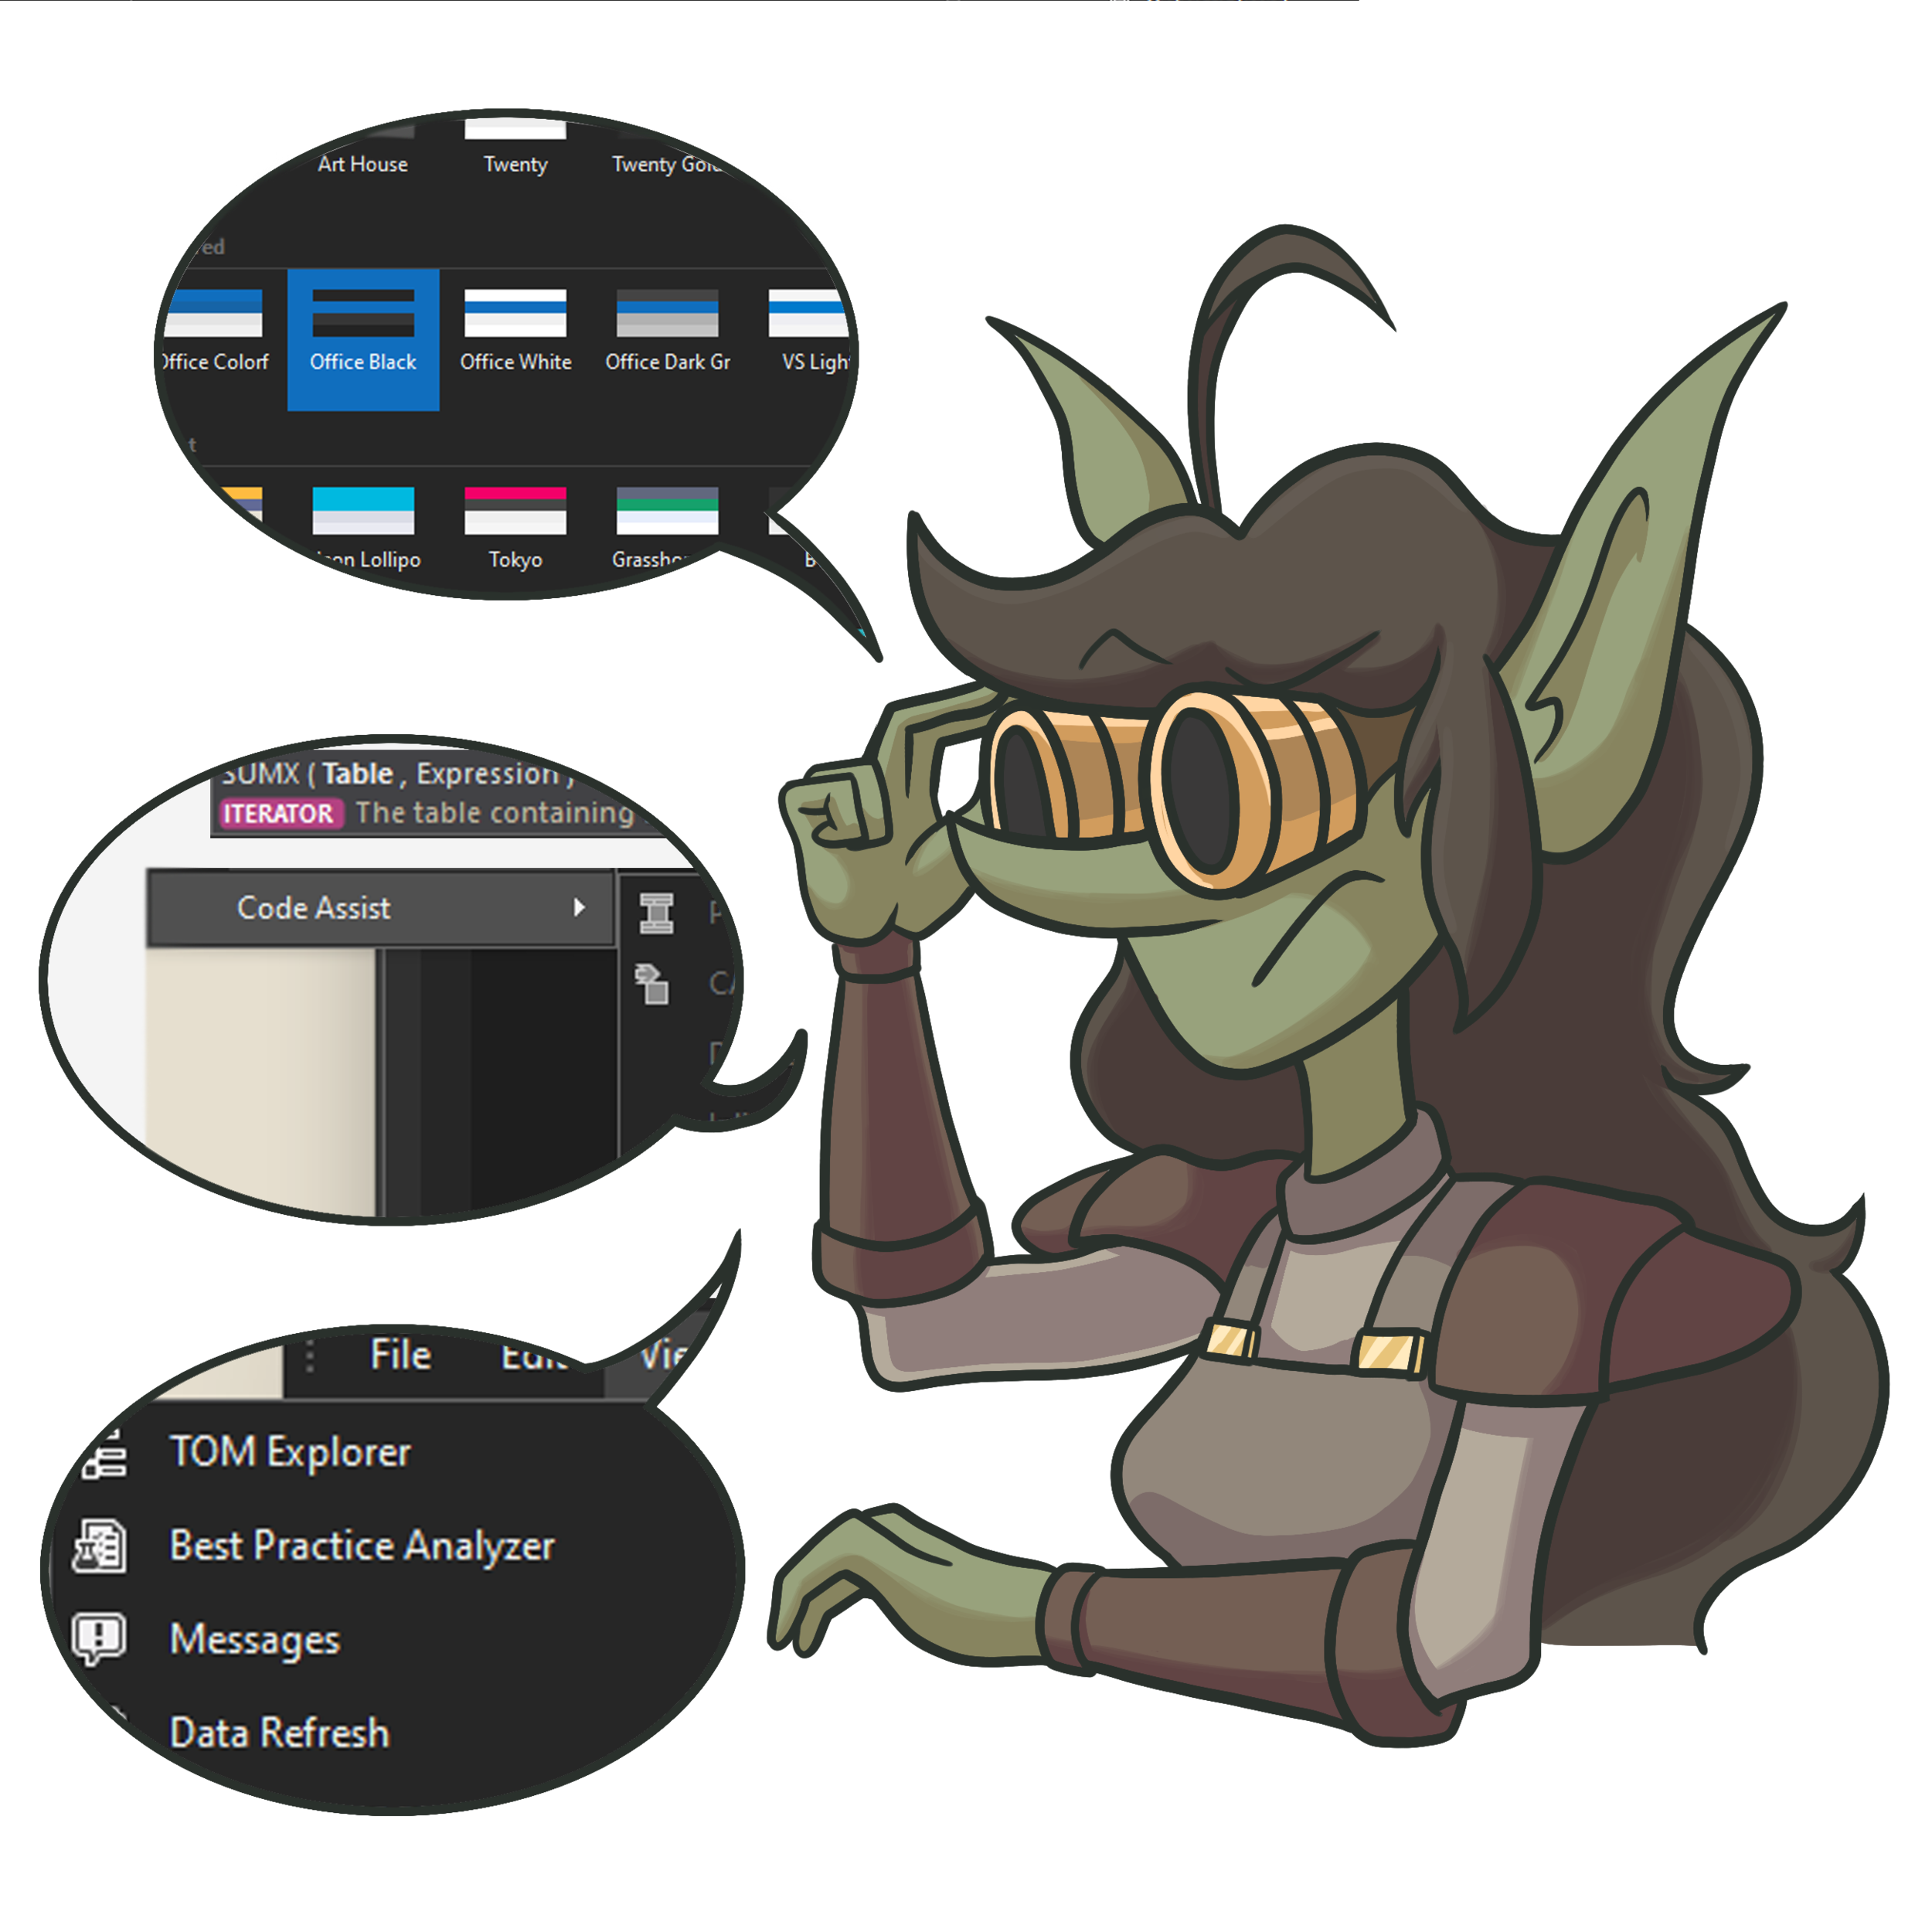
TE3 is stuffed-full of features. There’s a lot to unpack, that much is clear from the code assist section, alone.
View: This reveals windows that are closed or not presently visible. The default view has all of these visible except for the Best Practice Analyzer, Dependencies, and Debug windows. Below I will just briefly summarize what each window shows/does, as I have written separate articles about each of them which I will be publishing in later weeks (from now: Jan 2022).
TOM Explorer:
One of the major reasons why Tabular Editor has become such a popular tool for developing Power BI data models, the TOM Explorer is an interactive, indented, tree-like view of the tabular object model (TOM). This gives a nice overview of what’s in your model, and is where you will be creating, modifying and organizing (in display folders) objects. Intuitively dragging & dropping objects from the TOM Explorer to other windows (or to other parts of the TOM Explorer) is also supported.
Why it’s helpful: This is the meat & potatoes of Tabular Editor. It’s such an elegant way to browse and interact with model objects, and supports simple UX features like drag & drop, or an extensive, context-dependent right-click menu.
Best Practice Analyzer (BPA):
A tool that uses rules to automatically scan your model for violations, to enforce standards in the model and alert the user to any properties or expressions that may be violating best practice conventions. A common example are [Columns] not clarified with the ‘Table’ name before it.
Why it’s helpful: The Best Practice Analyzer is particularly handy if you are often exposed to models created or modified by others, and you need to save time in checking them for potential issues. If you invest time in setting good rules that work for you (there’s a good standard template to start with), you can be notified when inevitably making a mistake, or inadvertently making a model decision that goes against best practices.
Messages:
Where you are alerted to problems in the model (i.e. from the BPA) or authored code (DAX, or errors compiling C# scripts). Double-clicking the message will instantly navigate to the problem object.
Why it’s helpful: Since TE3 will automatically proof your DAX code, this is a fantastic time-saver for squashing bugs and finding issues.
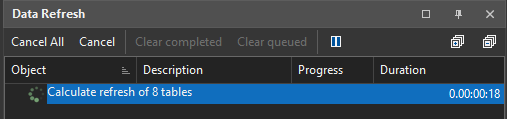
Data Refresh:
The UI that shows in-progress and completed asynchronous refreshes; i.e. when you use Tabular Editor 3 to refresh or recalculate parts of the model (tables or partitions).
Why it’s helpful: If you need to refresh a single table or partition ad hoc, the Tabular Editor UI is definitely the most effective way to do this.
Refresh tables & partitions from Tabular Editor 3’s TOM Explorer
Expression Editor:
Where you edit DAX expressions for various TOM objects (measures, calculated columns, calculated tables, roles, detail row expressions, calculation items), as well as edit M code (for partitions loaded into the model and shared expressions like parameters, which aren’t).
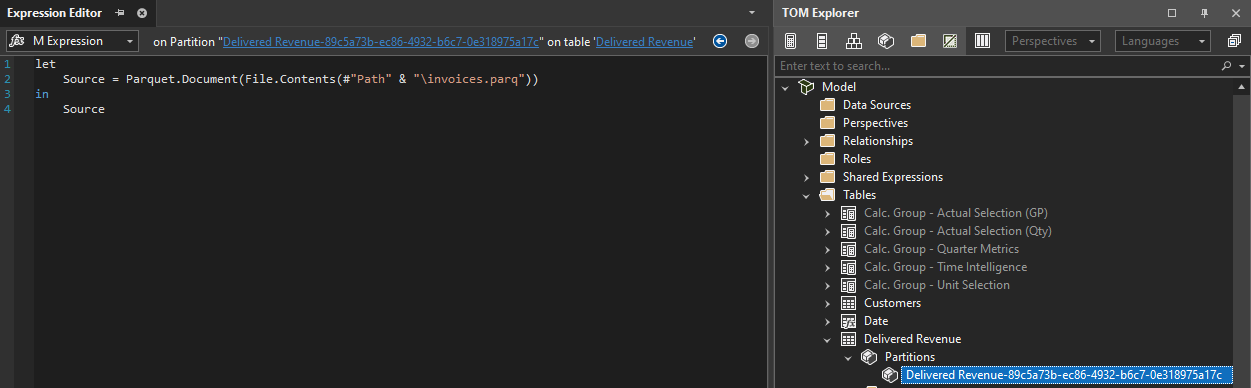
Change M code outside Power BI - M code made in Power Query can be viewed & changed from Tabular Editor
Macros:
C# scripts that are saved for easy re-use from the right-click context menu.
Why it’s useful: This is Pandora’s box - the C# scripts & macros in Tabular Editor 2 & 3 can really explode your productivity. You can create custom actions to automate or streamline development tasks, from basic things like formatting all the DAX in your model, to more complex operations.
VertiPaq Analyzer:
Integration of the VertiPaq analyzer tool, which can analyze and provide valuable summary statistics about the data model. The VertiPaq analyzer is also integrated in the DAX Studio external tool.
Why it’s useful: Collecting statistics on your model is an essential step prior to optimization. This will inform you about bloating objects in disk size as well as the cardinality size of relationships. When troubleshooting a model, a first step should always be running the VertiPaq analyzer.
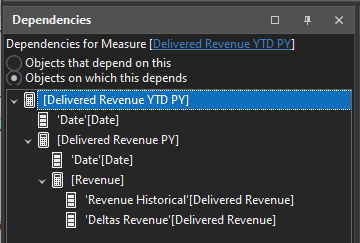
Dependency tree for a measure
Dependencies:
Reveals dependency trees for model objects (i.e. if a measure is dependent on 2 other measures, and a column). You can explore in both directions, objects that depend on what you’re selecting, and what that object is dependent on.
Why it’s useful: This makes it easy to explore models and understand the upstream or downstream objects for any given measure, for example.
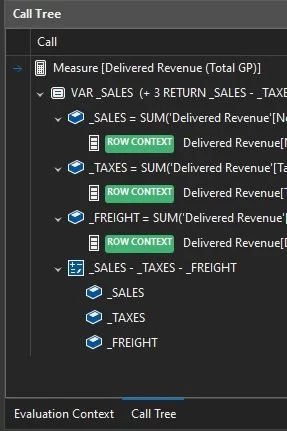
Call Tree for a DAX measure in a query
Debug:
A recent acquisition to Tabular Editor version 3.2.0, Debug pertains to the new DAX Debugger feature of Tabular Editor 3. This allows you to investigate explicitly defined measures in your model using the Pivot Grid, or in DAX queries produced by SUMMARIZECOLUMNS (i.e. like the ones generated in Power BI, that can be copied & pasted from the Performance Analyzer).
Why it’s useful: This is a very valuable tool for a developer to write complex DAX code more effectively, and understand better what is happening in each step of the process. Using a DAX Query or Pivot Grid, you can right-click a cell and ‘Debug’ the explicit measure result. This will give you information about:The Call Tree of the measure
The Evaluation Context of that cell
Local variables active in part of the code
On top of this, you can also experiment in the evaluation context to understand how other expressions would be evaluated. Using the watch window, you can enter other DAX expressions ad hoc, then evaluate them to see what the result would be. This helps you better understand the evaluation context and what is happening in DAX.
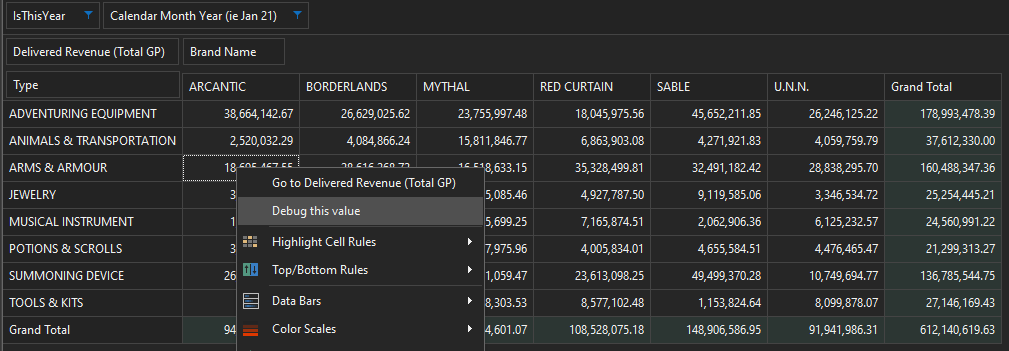
Starting a debug session from a Pivot Grid, using an explicitly defined measure
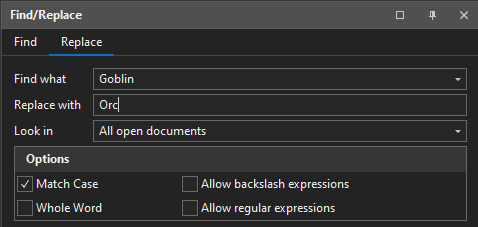
Find & Replace DAX in Power BI (works with M, C# also)
Find & Replace:
Mentioned already several times above, the Find & Replace window is opened from within the Edit menu. It can be docked in the layout.
Why it’s useful: A big time saver for making consistent replacements in code. Having Find and Replace in Power BI DAX makes it so you can replace single words, object references, or complex text that might be re-used. You can also search across the entire model for certain words, or using RegEx if you’re a god among us common folk.Properties:
Last is the Properties window, which shows information about a particular TOM object in the model that is being selected. The properties in this section can be altered from the Tabular Editor UI, but recall that not all of the properties can be modified from Power BI Desktop.
Hopefully this has been a useful summary of various key features accessible from the basic Tabular Editor UI. Future articles will go further in-depth about specific features, how to most effectively use them, and exploring a few business (data) use-cases.
Click to expand - an overview of some key features in TE3
This post is part 3 of a weekly series I’m writing about Tabular Editor. Part 2 about TE licensing is here.
Next week, in part 4, we will dive deeper into the ‘meat & potatoes’ of Tabular Editor - the TOM Explorer

