

What are 'Details-on-Demand' matrixes in Power BI?

DYNAMIC HIERARCHIES IN POWER BI
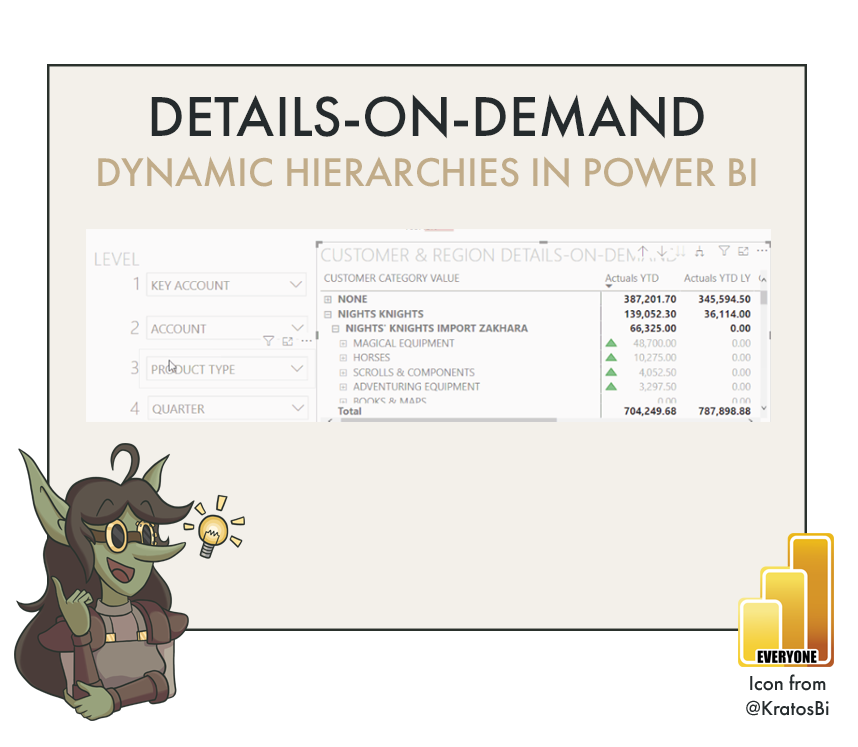
…for easy exploration of data in Power BI pivot table matrixes.
Note: This article was written in September 2020. It is recommended to execute this approach with Field Parameters instead of the traditional dynamic dimensions approach.
Example of a details-on-demand pivot table in Power BI using dynamic dimensions.

Time to Implement

Difficulty

Usefulness
Use-Cases:

DYNAMIC HIERARCHIES:
Sometimes, users will want to arrange hierarchies themselves. They might sometimes see ‘Region’ as a function of ‘Customer Account’, but at other times see it the other way around. Using this method makes this possible.

SELF-SERVICE-SAVVY USERS:
Users that have experience engaging with Power BI reports and all the interactivity therein can extract a lot of value from having more flexible reports. Arranging their own way of drilling down into the data supports them to do this.

DATA EXPLORATION & VALIDATION:
It isn’t just valuable for your users, but also for you and your teams. Exploring detailed data can often result in creating a lot of ad hoc tables for tests & checks. Having more flexibility reduces the time you need to spend on this to find answers to your own questions about the data.
When to not use it:
Since this is a specific use-case extending the utility of ‘Dynamic Dimensions’, it has the same limitations.
LARGE OR UNDER-PERFORMING MODELS:
The relationship between the ‘Index’ field in the pivoted table and the normal ‘Dimension’ table must have bi-directional cross-filtering for this to work. Thus, large datasets or poorly-optimized models can experience a significant performance impact with this method.
For very large datasets, or those which are well-optimized, this method is not advised.
DIMENSIONS WITH HIGH CARDINALITY
Like with the dynamic dimensions approach, this method involves pivoting the Dimension table to create an ‘Attribute’ for each column and a ‘Value’ for each Dimension member. The more unique dimension members and columns, the bigger this table can be. When going down to the level of i.e. individual product codes, or by minute for a date dimension, this can exponentially blow up the storage bloat of the model, just for one feature.
How to do it - Ingredients:
DATA STORAGE:
IMPORT
COMPOSITE
DIRECT QUERY (IF TABLES ARE CREATED IN BACK-END)
METHOD:
POWER QUERY
VISUAL MACGUYVERING
ELIGIBLE WITH:
MATRIX VISUAL
ANY VISUAL WITH HIERARCHY CATEGORY DRILLDOWN
I discovered this myself after learning Dimension Selection
How to do it - The Recipe:
Step 1: Set up Dynamic Dimensions. Depending on how you want your dynamic hierarchies to be set up, you may want to do this multiple times for a single Dimension table.
For example, if your ‘Customers’ dimension contains information about both ‘Region’ and ‘Customer’, users may want to split both. Within reason, you can add a ‘Dynamic Dimension’ table for each dynamic layer of the hierarchy.
Step 2: Add the slicers and a matrix visual to the report. Arrange them in such a way that the hierarchy is obvious to the user.
It is helpful to explicitly call out each level, using i.e. “Level 1”, or “Level 2” for each slicer. Put the slicers either to the left of the matrix or above it, so that the interactions are obvious to the user.
Step 3: Using ‘edit interactions’, disable interactions between the different slicers, as well as interactions with other page visuals other than your ‘details-on-demand matrix’.

These dimensions might unexpectedly interact with other elements of your model to produce strange results. To avoid this, ensure that the slicers for this functionality only are interacting with explicit elements of the report for which they are designed. If your entire report is designed around this functionality, then of course you can go nuts. But I wouldn’t recommend that… the impact of this approach on performance can be quite severe in medium - large models.
Step 3: Add the ‘DimensionValue’ field in the order which you want to present your data. Try to limit the more detailed dimensions to the lower levels of the matrix.

Step 4: Add measures and disable cross-filtering to other visuals.
Similar to what you already did with the slicers, the cross-filtering from the matrix can have unexpected consequences for other visuals using ‘normal’ dimensions & hierarchies.

