Learn Power BI with Sample Datasets: Part 1 - Contoso Data Generator
PRACTICE POWER BI WITH YOUR OWN SQL DB
…either downloaded ready-to-go or generated to your specifications

Choosing the right test data to learn Power BI is important. You should get data that represents ‘real’ scenarios and also aligns with your learning goals.
LEARNING BY DOING
When learning Power BI, we need data to practice using features and functionalities. Everyone learns differently, but it is insufficient to only read or watch videos - even if they are full courses - to learn Power BI. We need to get our hands dirty. In practice, however, this is difficult. Where do we find data or databases to use for practicing? How can we fit that data to our learning goals?
In this series, we look at different ways to find or generate sample data we can use to generate reports or full solutions for learning, demos & portfolio projects. These articles are written assuming no prior technical knowledge, explaining things in plain language and assuming these sample data are used exclusively for personal use and learning.
Sqlbi have created a free tool, providing orders datasets of various sizes ready-made, or a means to customize our own Contoso sample dataset with different parameters. This dataset can be inflated to large sizes of over 100 million rows, and pairs well with essential DAX learning resources like dax.do and the sqlbi DAX courses.
There are many services and platforms collecting data about you every day, and easy means to get that data. From social media to geolocation and biometrics, we look at common datasets and use-cases for retrieving your personal data to create Power BI solutions that are useful to you & test your skills. This is particularly interesting for testing your Power Query knowledge, as these datasets often require a lot of effort to wrangle under control. It can also just be a lot of fun.
Depending on your goals, you might find that the datasets available don’t sufficiently fit your needs. In these cases, it’s often easiest to generate your own, fake data for your project. There are many tools & methods to do this, but in this part we look at 3 methods using Excel, Power Query and Python.
PART 1: CONTOSO DATA GENERATOR BY SQLBI

GitHub Site
I. INTRODUCTION

Typical sample datasets are small flat files that don’t represent a real dataset in any capacity. They are also usually very small, rarely forcing you to optimize for performance or data quality
WHY USE A SQL DATABASE?
Sample datasets often come as small files of a few hundred or thousand rows, typically Excel or .csv files, limited to 1-2 data tables. This is fine to begin a learning journey, but we quickly outgrow these small samples, in search of others that are larger and more representative of ‘real’ business cases. Below are some reasons why we need a sample database like SQL Server for learning and practicing Power BI:

Fake datasets help you learn to manage more representative sizes and shapes of data. You learn features that aren’t possible with flat files, and coping with challenges that you’d never cross with a few hundred thousand rows in Excel.
Practicing data modelling, arguably the most important, basic technical skill of a Power BI developer. You need a more sophisticated dataset with features & logic that at least partly reflect that of a believable business.
Many popular Power BI features don’t work with flat files, such as Direct Query, Query Folding or creating partitioned tables with Incremental Refresh or Hybrid Tables. If you practice exclusively with flat files, you will be entirely vulnerable and inexperienced when confronted with real-life scenarios that require these features.
Creating and managing large data models require significant thought and effort in optimization. If your sample dataset is tiny, DAX or data model optimizations are trivial or entirely not necessary. It’s difficult to find larger and more representative datasets of millions (or even billions) of rows, but essential so you can be confronted with performance challenges as you work with these datasets.
These are only three select examples among many. There are extensive benefits to setting up your own, local SQL database, populating it with a decent sample dataset to learn and practice Power BI (or SQL, itself). This is where the Contoso Data Generator comes in handy.
Logo of Contoso, a fictional retail multinational
WHAT IS CONTOSO?
Microsoft created a fictional corporation called ‘Contoso’ for demonstrations or trainings of their data products and solutions. Contoso is a multinational retail corporation based out of Paris, France with a catalogue of more than 100K+ products and thousands of customers. It has become well-known for it’s prevalence in training material, not only from Microsoft but also third-party vendors. The original ‘Contoso dataset’ can be downloaded ready-made from Microsoft, though is limited in the available information and structure; it feels dated, and lacks the flexibility to scale up the rowcount or complexity. To this end, sqlbi have provided the Contoso Data Generator, allowing anyone to pick-up and go, or customize their own SQL Database.
THE CONTOSO DATA GENERATOR
The generator is freely available from GitHub, and can be one of 3 things, depending on what you need. In this article we will cover 2 of these 3 use-cases for setting up your own Contoso SQL database for use from Power BI:

It’s also possible for C# developers to extend the generator to include additional features or data.
This will not be covered in this article (since I’m not a C# developer 🙃)
PRE-REQUISITES: WHAT YOU NEED TO USE IT
You first need a SQL Server available where you have write access and can restore the .bak files. Depending on your resources and where you are in your learning journey, it is likely that this is not the case. Don’t worry; this is quite easy to set-up, and doesn’t take much time or effort. Below is a full list of the pre-requisites you need:
A SQL Server or Azure SQL instance where we can restore the .bak files
or
SQL Server 2022 Developer Edition installed, to run a local SQL Server
SQL Server Management Studio (SSMS) or Azure Data Studio (ADS), to restore the back-ups
To configure your own Contoso Database by running the scripts, you also need…
7-zip (installed on the same PC as SQL Server)
User running the SQL Server service must be able to access a temporary folder (C:\Temp)
II. SETTING UP SQL SERVER
The first thing we need is a SQL Server where we can put our database. If you already have access to a SQL Server or Azure SQL instance where you have appropriate permissions, this step is not necessary. Otherwise, below is a simple step-by-step guide to setting up your own SQL Server. It’s straightforward:
The easiest way to get access to a free SQL Server is to run it from your own computer. To do this, you simply have to install and run the SQL Server service from your machine. This is free to do for testing and demonstration purposes using the SQL Server Developer Edition. Below is a simple walkthrough explaining how to download and install SQL Server for your local machine. The user interface is darker because I have configured dark mode for all applications.
Once you have installed SQL Server, you should test the connection from Azure Data Studio (ADS) or SQL Server Management Studio (SSMS). The below explanations are given for Azure Data Studio. If it looks different from your windows, it is because I have configured dark mode on the user interface.
NEXT: PUTTING DATA IN THE DATABASE
We’ve installed the SQL Server on our computer and are running it in the background. From here we can add data to our local SQL Server database from the Contoso Data Generator, so we can connect to and use it from Power BI Desktop.
We can either download one of the ready-made .bak files from GitHub, or we can download the generator and configure it to create our own to our specifications. In the next section we look at a simple step-by-step of how to do either of these.
If this is your first time installing SSMS or SQL Server on your machine, you will not be able to create a new alias using the method described, above. Instead, you should use the Configuration Manager. You have to set this up both for the 32-bit and 64-bit versions.
32-bit: C:\Windows\System32\cliconfg.exe
64-bit: C:\Windows\SysWOW64\cliconfg.exe
This is described below. If you already were able to create a new alias, you can skip this step.
Thanks to Marco Russo for raising this!
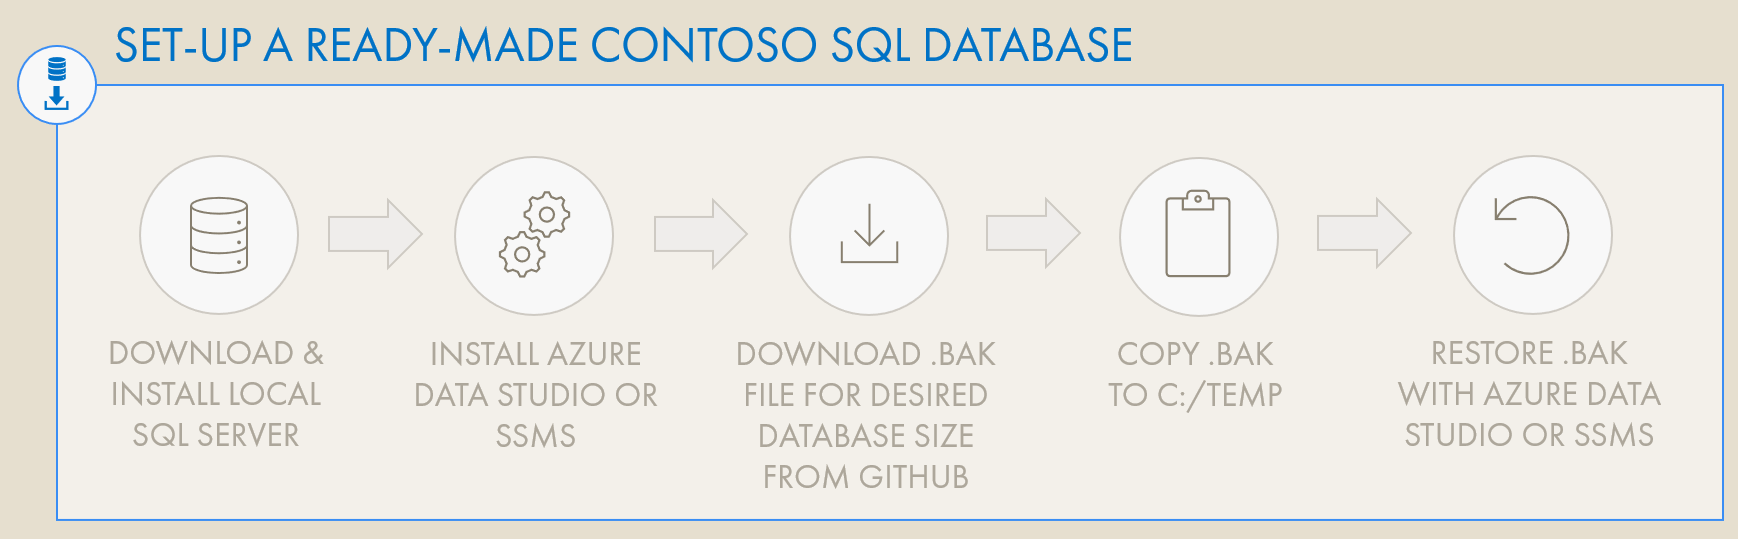
III. DOWNLOADING A READY-MADE CONTOSO DATABASE
Now that we’ve set up our SQL Server, we need to fill it with a database. Using a back-up file from the Contoso Data Generator makes this simple; we don’t need to write any SQL code. If we just need a SQL database of a certain size (10K rows, 10M rows & more), we can download ready-made Contoso databases from the Contoso Data Generator GitHub site. Below is a simple overview of how to set up these ready-made Contoso databases in our new SQL database:
First, we just have to go to the Contoso Data Generator GitHub site and download the database we intend to use. The only difference between them is the size. The rowcount is indicated for each .bak file (10K - 100M).

Once we have the file, we need to copy it into a directory accessible by SQL Server; we won’t be able to restore the backup if it is in a directory belonging to a single user. Copy the downloaded .bak file to a temporary folder such as C:\temp.

Thereafter, we just need to restore the backup file within either Azure Data Studio or SSMS. This is very simple, we just right-click the connection and select ‘Manage’. Select ‘Restore’ from the top of the menu. In the ‘Restore database’ dialogue pop-up, select ‘Restore from: Backup file’ in the first drop-down, and select the .bak file you just copied to C:\temp.
That’s it. We can now either test and work with the database from within Azure Data Studio/SSMS or Power BI. To connect from Power BI we just connect to a SQL Database of server ‘localhost’ using Windows credentials, since we are on the same machine. The database comes clean, but we can make transformations in Power Query if we want to. We can even see the query folding if we right-click a step to view the native query.
We now have a SQL database populated with data we can query from Power BI. If that is all we need, we can start performing transformations in Power Query, writing SQL Native Query, or whatever we want. However, looking at the data, we notice that the latest date is in 2021. What if we wanted to have data until today, and create a Power BI dataset that - when refreshed - could bring in new data every day, simulating a daily business? Further, what if we wanted to change the distribution of the data, or another parameter?
For this, we need to generate our own, custom Contoso Database with the generator.
IV. GENERATING A CUSTOM CONTOSO DATABASE
The Contoso Data Generator can create a custom Contoso database directed by some parameters. By modifying the config files and running the scripts, we can create a new .bak file that has a different date range, more rows, more customers, or a number of different changes. Below is a step-by-step overview on how to get the generator and use it to create a custom SQL database with dates up to or past today:
To generate our own Contoso database, we need to first download the Contoso-Data-Generator-exe-1.1.0.zip (latest version as of December 2022) from the GitHub site. This .zip file contains the scripts, configuration files and seed data to generate the database. Next, we have to make sure that we’ve downloaded the pre-requisites; 7-zip used to create the compressed database files, and .NET Core 3.1 to run some of the scripts.
Before we use the Generator, we need to do one small step to configure our new, local SQL Server database. We need to create a new Alias which will be used when running the scripts. If you’ve never done this before, it’s explained in simple terms & steps, below:

Inside the extracted directory, we can use the configuration files in Contoso-Data-Generator\DatasetSqlbi to parameterize the dataset to our liking:
data.xlsx contains information about the seed data used in the generator. We can change weights and attributes to change the result in the final dataset. For example, if we want different categories, or even different product and store names.
config.json contains parameters such as the number of years of data, the count of orders, the start & stop dates, as well as arrays to use for weights of the order rows, quantities and other quantitative information.
In this example, we want to create a fake Power BI dataset that will take data until today, bringing new data with every day that we refresh the dataset. To do that, we will generate data until a future date, like the year 2025. We can also increase the number of orders or other parameters if we want to increase the row count.

To run the generator, we just need to use the PowerShell script ‘GenerateDatabases.ps1’ found in Contoso-Data-Generator\Scripts. Right-click the script and select ‘Edit’ to open it in Windows PowerShell IDE.

From here we see why we needed the alias ‘Demo’, as it’s used in the script. We could have used a different alias name, but it’s another thing we would need to change. We also have additional parameters specified in lines 62-69 for $databases. The last thing we need to do is just select the database variant we want, adjust some in-line parameters and run the script.

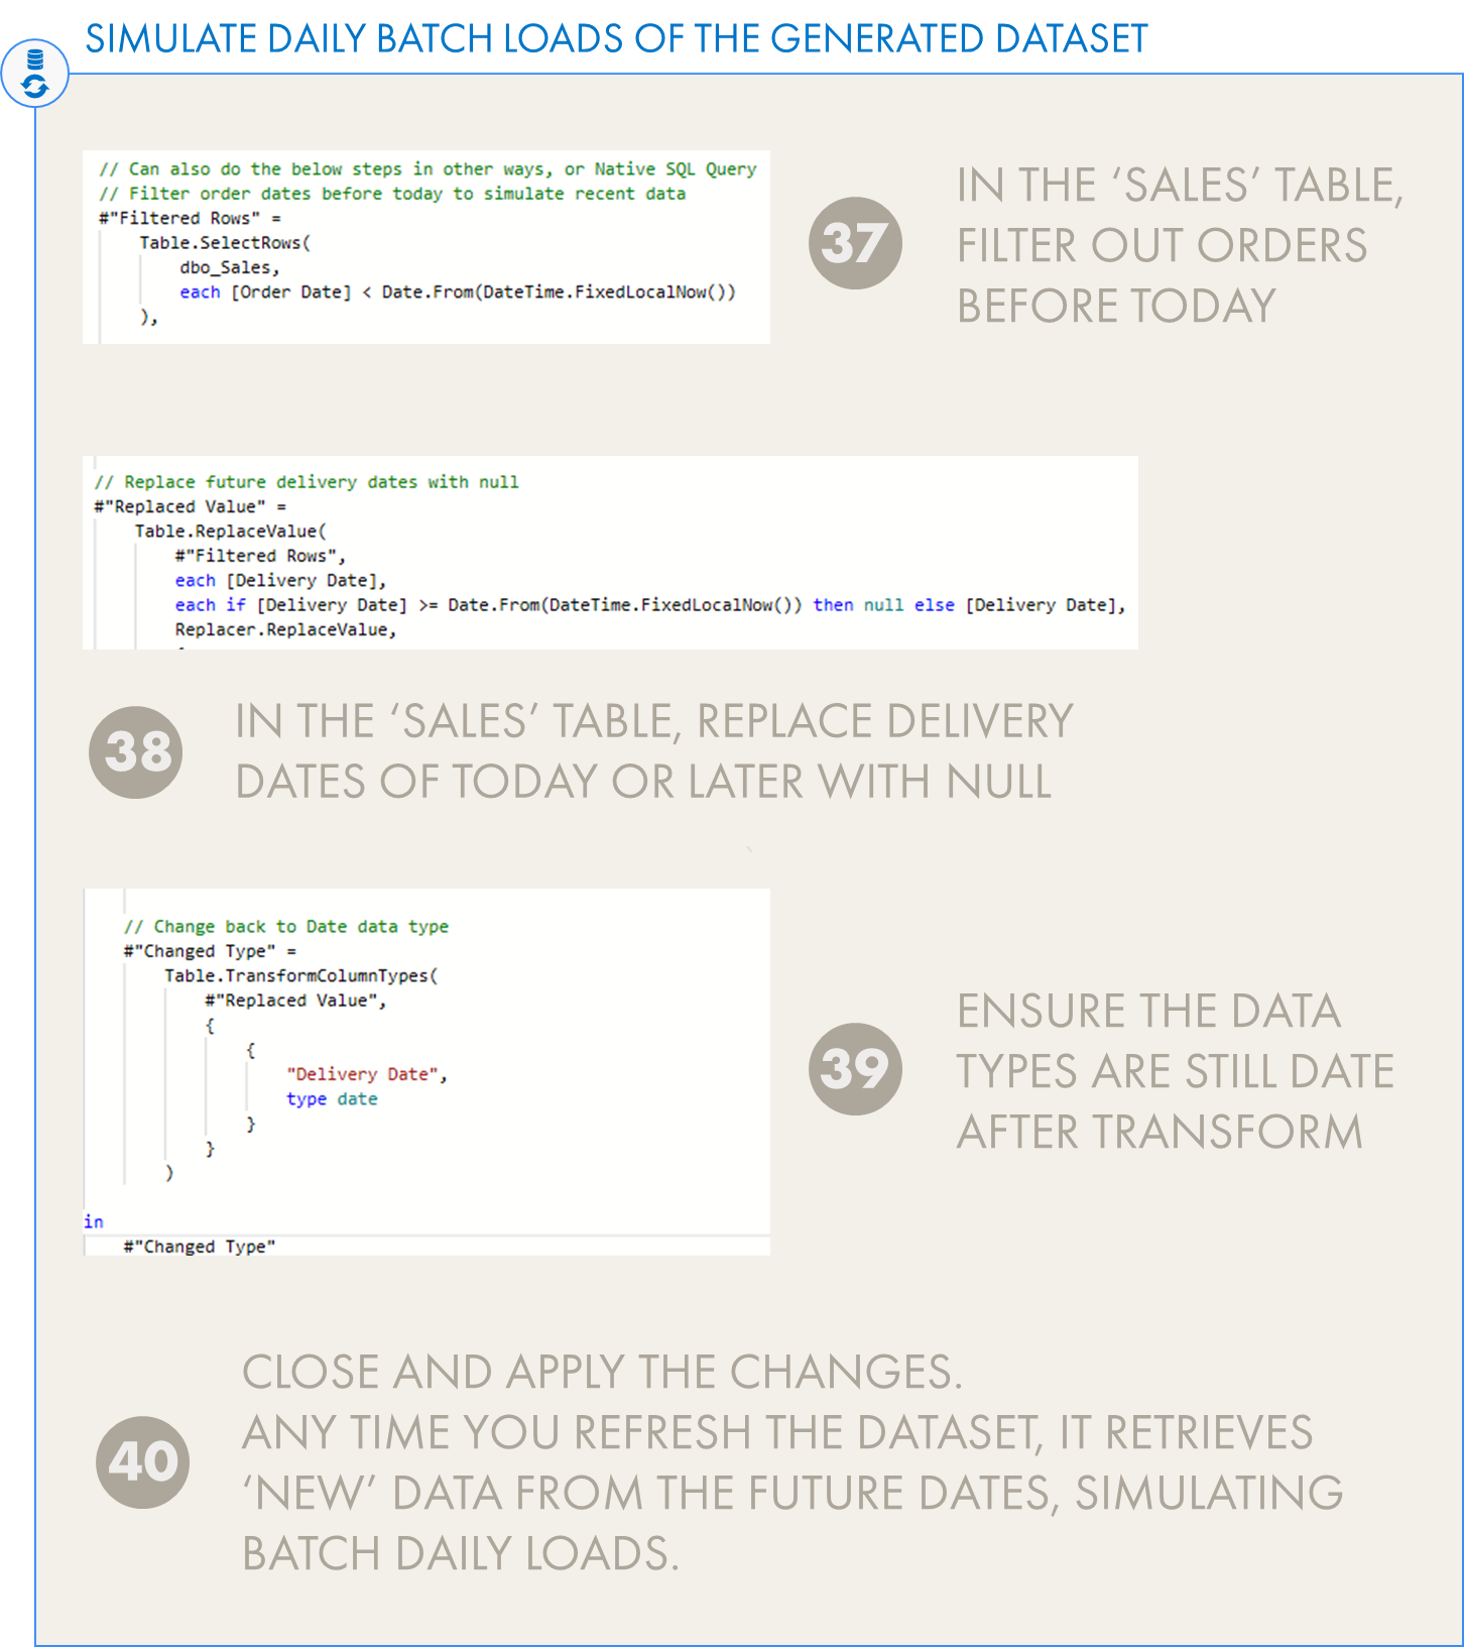
We can now query the resulting database from Power BI. To give the ‘illusion’ of new daily data, all we need to do is make some adjustments in Power Query to filter rows with [Order Date] before today. This simulates daily batch loads of order data. Next, we have to render all ‘Delivery Dates’ equal to today or later null (since they wouldn’t be delivered in the future, of course).
The result is a dataset that will always have new data, whenever its refreshed. We can publish this dataset to the Power BI service and refresh it, if we add a connection to our local SQL Server to the Data Gateway. This also has the added advantage of using the data in Dataflows or Data Marts, for example, but this goes a bit beyond the scope of this article.
V. CONTOSO BUSINESS CASES FOR LEARNING POWER BI
This is just scratching the surface of what is possible with the Contoso Data Generator; a basic intro. By tweaking the parameters and applying some creative steps during data loading, it’s possible to get a wide range of data shapes and sizes to fit your needs. But how can you best use this to learn? What kinds of things can you make with this Contoso Dataset that can test your skills & flex your learning muscles?
MAKE SOMETHING USEFUL THAT ANSWERS BUSINESS QUESTIONS

Real data solutions don’t exist in a vaccuum. They are designed to help people answer questions and solve problems. To this end, even if you have an elaborate and complex sample dataset, messing around in Power BI without a clear goal isn’t going to help you learn or make useful things. Instead, it’s recommended you approach the dataset from a business perspective, scoping out a specific visualization, report or solution that addresses a business question. You can then draft a design and attempt to implement it, applying the learning resources at your disposal.
This not only will help you learn Power BI in a more ‘realistic’ way, but will also teach you skills of critical and analytical thinking. You can not only practice technical solutions, but apply them while focusing on a (fictional) business user’s point-of-view.
Below are some business cases and questions that I’ve come up with for the Contoso Data Generator. These business cases will help you practice Power BI by applying technical solutions and methods to address a business problem. Like a real business case, there may be no clear answers or “best” solution. They also will not be easy. Nonetheless, take a crack at solving them.
For all business cases, you should use datasets described in steps 30-40 which have simulated daily batch loads. If you were not successful in generating this yourself, I’ve provided a .pbix (10K), but you should try to generate it yourself, first. Remember, you should use a 10M+ row Contoso DB for this to be the most valuable exercise.
Feel free to ask questions in the comments about the cases. Maybe a business user will answer.
CASE 1 - THE EXECUTIVE OVERVIEW
Business Case Description

An executive at Contoso - the VP of the European Division - has asked us to create an ‘Executive Power BI Dashboard’. The purpose of the dashboard is to track weekly performance of our operations. In their email, they list out in bullet points what they want to see. They don’t have time to further discuss, and ask us to create a draft to discuss with them on Friday at 08:00 (it’s currently Tuesday at noon). In that discussion, they will give some feedback together with the General Managers and we will discuss the next steps. One of the analysts from the Finance department who has created Excel reports for the VP & GMs in the past provided some additional notes so we can get started:
Metrics:
Shipments: Unit Price * Quantity by Delivery Date
Unfulfilled: All presently undelivered orders
Express (%): % of order lines (Order Line = transactions; unique combination of Order # + Line #) delivered within 1 day of ordering
Std. Margin: Net Sales (Net Sales = Net Price * Quantity by Billing Date) - Cost of Goods Sold (COGS = Unit Cost * Quantity by Billing Date)
Std. Margin (%): Std. Margin / Net Sales
Questions the Report Should Answer:
How much did we ship yesterday? Is it more than the average in the last 28 days?
How much have we shipped this week compared to the same week last year?
How does this look per country?
How does this look between Online vs. Physical Retailers?
How does this look per product category?
How many unfulfilled orders do we have?
Who should be shipping those orders? Which country?
Is the % Express orders increasing vs. prior weeks? vs. prior year?
What is our margin % so far this year vs. last year?
How does this look per country?
How does this look between Online vs. Physical Retailers?
How does this look per product category?
Which countries & brand have had the biggest drop in margin %?
Other Requirements or Information:
The data should be in EUR and Pieces (Quantity)
The data should be filtered to only European countries
All products from USB devices should be filtered out (these products are in our sister company’s catalogue now; not Contoso)
In Europe, the Billing Date is always the next working day after delivery
In Europe, the week starts always on a Monday
The European management always look at shipment data Week-to-Date (WTD), meaning they filter on a given week and cumulate from Monday to Sunday.
The Margin data is always seen YTD because discounts are applied on annual contracts
The executive doesn’t like clicking around too much; they want to be able to “see whats going on at a glance”
The report cannot be more than 3 pages.
The executive is really impatient; they say they shouldn’t have to wait more than 2 seconds to see the data.
The report will need to adhere to Contoso Branding, google to see their logo & colour palette.
Your Task
Try to get in the head of this Executive and understand what they want to see. Create a report that fits the above requirements and try to understand why they are asking these questions. Which of these questions is most important? Why? How can we convey the information most effectively? How can we create a report design that is clear, concise and easy-to-use? How can we make sure that we don’t overwhelm the executive users with information?
Create a report of maximum 3 pages that fulfills these requirements for this initial demo and discussion. Pay attention to some of the details, like the dates that need to be used for specific calculations, or that the week starts on a Monday. You will need to transform the data, build a model, write the DAX, and then design & build the report, itself.
CASE 2 - GOING GLOBAL
Business Case Description

The Executives were pretty excited by our first report. The discussion went well and they gave us some more information. They discussed how there’s a need for actionable reporting, and a push to reach shipment and margin targets. They want us to shore up this first version and prepare for a demo for the C-level executives. To do that, though, we will need to make some adjustments to the model & report.
Your Task
Revise the model and report with the below criteria
We need to remove the filter; we have to include all the global data, now
We should filter out USB products only in Europe. In Australia, we have to filter out Video Games (we are in the process of selling that division and our CEO doesn’t want to see it in OPS reports)
The exchange rates in our data model are apparently both incorrect and incomplete.
We’re told the CEO (from Canada) looks at all reports in CAD. Corporate Finance download the Exchange Rates from Bank of Canada and use the rates from the last day of each month, applying them to the entire month. For incomplete months, the exchange rate of yesterday is taken.It should still be possible to use these End-of-Month rates to select a different currency (Dynamic currency conversion)
We need to show the CEO that the data model can be secured:
Sales from each country should only see their own data, and cannot see Margin information
GMs can only see data from their own continent
Finance Controllers from each country should only see their own data
In North America, the Billing Date = Delivery Date. In Australia, the Billing Date is the next calendar day after delivery (not like Europe, where its the next Working day).
Corporate & Australia look at WTD data starting on Sunday, but Europe wants to see this starting on Monday. They want to know if there is a way to switch so that it is possible to have both
CASE 3 - PROJECT FOURSQUARE
Business Case Description

While preparing for our C-level demo, the VP has asked us to prepare another analysis. This is for an important project that has been going on since last year called “Project Foursquare”. The purpose of the project is to conduct a segmentation exercise of our products and customers to understand where we should focus, and from where we should divert attention.
The VP asks to make a new 1-page report that shows:
Top customers: Which customers are responsible for 80% of our shipments last year (Customer Pareto)
Top products: Which products are responsible for 80% of our shipments last year (Product Pareto)
What % of our sales are:
Top customers buying top products
Top customers buying other products
Other customers buying top products
Other customers buying other products
How the above has changed this year — whether the above %’s have increased/decreased, and:
Customer Fallers: How many Top customers have dropped this year to “Other customers” if we were to repeat the Pareto on this year’s shipments
Customer Risers: How many Other customers have risen this year to “Top customers”
Which countries had the highest risers / lowest fallers
Product Fallers / Risers: Repeat the above for products, and analyze by brand
Your Task
Attempt the analysis and come up with a proposal for the VP.

TO CONCLUDE
Setting up your own SQL database can help you learn Power BI. You can load it with data you already have, or download/generate some from the Contoso Data Generator. This will let you practice with features and data structures you won’t find in flat files.
To use such sample data effectively, though, it’s important that you treat it like it’s coming from a real business. With business cases like the 3 above, you have some sample personas and projects to start designing and building a solution that tests your abilities.