


How to hide blanks in Cards & KPI visuals in Power BI, easily
REPLACE (BLANK) WITH SOMETHING MORE USER-FRIENDLY
…using the COALESCE function in DAX or conditional formatting to transparency
Why hide Blanks?
Most business users don’t understand the concept of what a (Blank) or NULL value is. When filtering a report to a very granular level, users might obtain a result where there no transactions in scope of the filter context they have applied to the report, wherein a visual would show empty; for example, no sales have occurred for the selected product & region on the particular date. For charts, this results in no data shown, but cards render the (Blank) value. Depending on the report & user, a user unfamiliar with this result might interpret it as an error of the report, if they don’t equate (Blank) with a transactional absence. Instead, they might expect to see a zero, for example to say we have “0” sales at this period, or just hide the value, consistent with the behavior in other charts. This thus often results in one of two requests:

Replace (Blank) with 0
1. Replace (Blank) with 0 in the report, particularly with time series, cards & KPI visuals. This is usually something one might address with DAX, for which SQLBI have a really good article on that topic, linked here. Therein, the author discusses a requirement for evaluations to return null before the product is sold the first time (as they were not yet on the market), but if transactions are missing between the first and last sale, the user would expect to see 0.
For less nuanced cases, it is also possible to use a Calculation Item to conditionally replace SELECTEDMEASURE() with 0, as in the below DAX in a calculation item, applied to a visual level filter, or to selective visuals via hidden report slicers. This is also possible using COALESCE instead of an IF statement:
IF ( ISBLANK ( SELECTEDMEASURE () ), 0, SELECTEDMEASURE () )

Hide (Blank) entirely
2. Hide (Blank) rendered value in visuals. One might attempt this in DAX to replace (Blank) with empty string ( ““ ), but this does not work with the KPI visual. However, it can be quite easily achieved with conditional formatting, as seen below.
Use conditional formatting to match the background
With the UI

New cond. formatting options
To hide the blank, you can make use of the broader conditional formatting options for the default Power BI visuals.
You just have to set a conditional formatting rule that if the value is blank, the colour should be the same as the background.
That way you don’t have to do anything to your original calculation; it is just a setting specific to the visual.
Unfortunately this doesn’t yet work with transparency, so you must actually match the background colour, itself.

A simple formatting rule to match the background colour of the visual
Or with DAX
Here you define a measure [KPI-Negative], which is used to conditionally format both the ‘Good Color’ and ‘Bad Color’ of the ‘Color coding’ option in the visual Format pane.
IF ( ISBLANK ( [Delivered Revenue (Total GP)] ), "#F5F2EC00", "#E81123" )
#F5F2EC00 will evaluate to a transparent colour hex code when blank, otherwise the red colour if not.
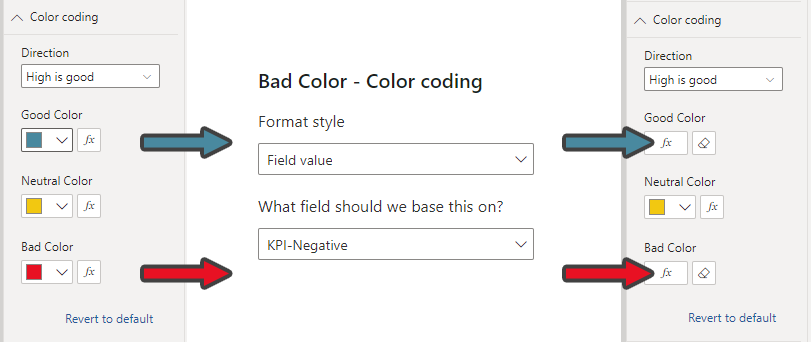
Do conditional formatting for the ‘Good’ and ‘Bad’ colours, depending on what makes sense and what has been observed in terms of blank values.

The result, as displayed above, where the (Blank) value is still there just hidden from the user as it matches the background.

