What Microsoft Fabric means for your semantic models: Scenario 1

ONE TEAM’S SEMANTIC MODEL
…how team of data scientists embedded in a business unit take their model from Power BI to Fabric.
This article is part of a series: What Microsoft Fabric means for your semantic models.
Scenario 1: Data science-centric team (this article).
In Fabric—like Power BI—you make different choices to build and use your semantic model in different ways. Various factors will motivate your decision to use one feature or approach over another.
In this article, I highlight one example of a scenario where a team goes from using Power BI to Fabric, and have made specific choices to support their needs and their way-of-working. Specifically, this is a small team more familiar with R and Python, but less familar with Power BI and other, traditional BI tools. Today, this team does their best to deliver business value by using Power BI, but they struggle to mesh their skills and workflow with the tools and features they have available. The result is a very painful process for both the analysts and the central BI team who has to govern them. Later, we’ll see if Fabric can improve the situation for this team, and what new considerations it brings along.

 The purpose of this article is twofold:
1. To demonstrate an example of how a team's workflow changes from Power BI only to Fabric.
2. To demonstrate semantic link in Fabric notebooks to consume semantic models.
This article is intended to be informative; I'm not trying to sell you Fabric, nor endorsing a tool, feature, or approach.
VIDEO ARTICLE
The video version of this article series is available in several videos which you can find here.
SCENARIO 1: BEFORE FABRIC

This team are a small group of analysts embedded in a demand planning team. They help that team with supply chain and inventory reporting. These analysts don’t have much experience with Power BI, and are more comfortable using various data science tools. Unfortunately, however, they don’t have access to organizational architecture, and are forced to perform much of their analyses locally. The way that this team works today provides a lot of headaches for the central IT team, who try to oversee and govern their Power BI environment.
Today, this business team struggles to use and get value from Power BI with their skills and way of working. They hope that Fabric will provide them more flexibility and agility to support their needs.
SCENARIO DIAGRAM: BEFORE FABRIC

This diagram reflects the painful processes that this team goes through to try to meet business data needs, today.
Data exports cause wasted time and create governance risk.
Local analyses restrict collaboration and make it difficult to scale and share their notebooks.
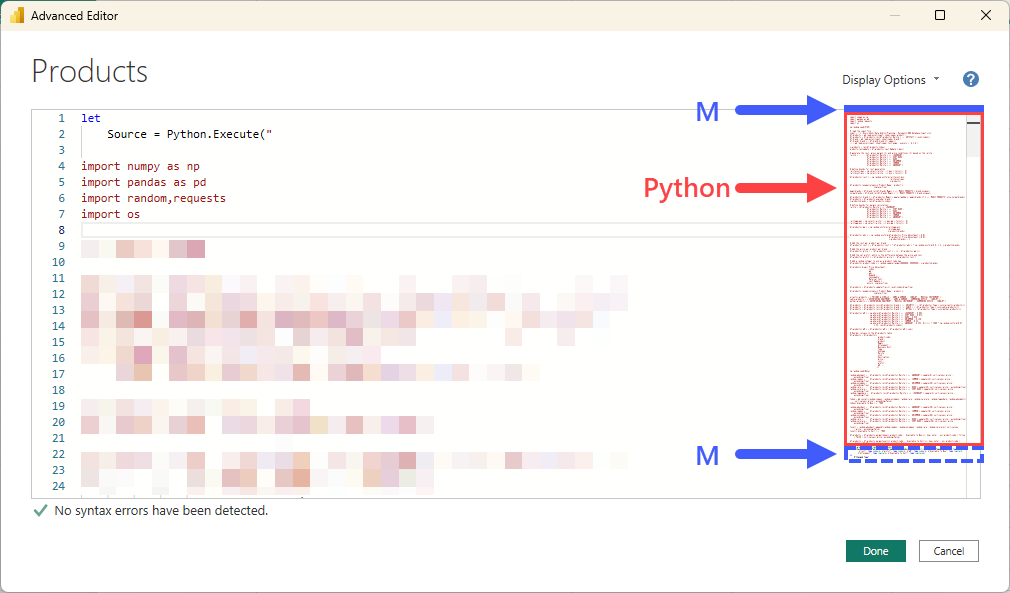
Python in Power Query force the team to use a personal mode gateway to perform scheduled refresh, which is problematic to maintain and govern, since it’s installed on one of their user machines.
In general, this team doesn’t have the tools to support their way of working. As a result, they’re bending and twisting Power BI to fit their needs. Even though they’re able to deliver some value for the business, this situation is creating a painful situation for everybody involved.
After the BI team implemented Fabric, this team will get access to additional tools and resources that might better help them, but they also have new considerations that they must keep in mind.
SCENARIO 1: AFTER FABRIC
With Fabric, this team’s workflow suddenly looks very different. It’s simpler, cleaner, and more effective; not only for the analysts, but also for the central BI team who can more easily monitor what they’re doing without dealing with exports, local notebooks, and personal mode gateways.
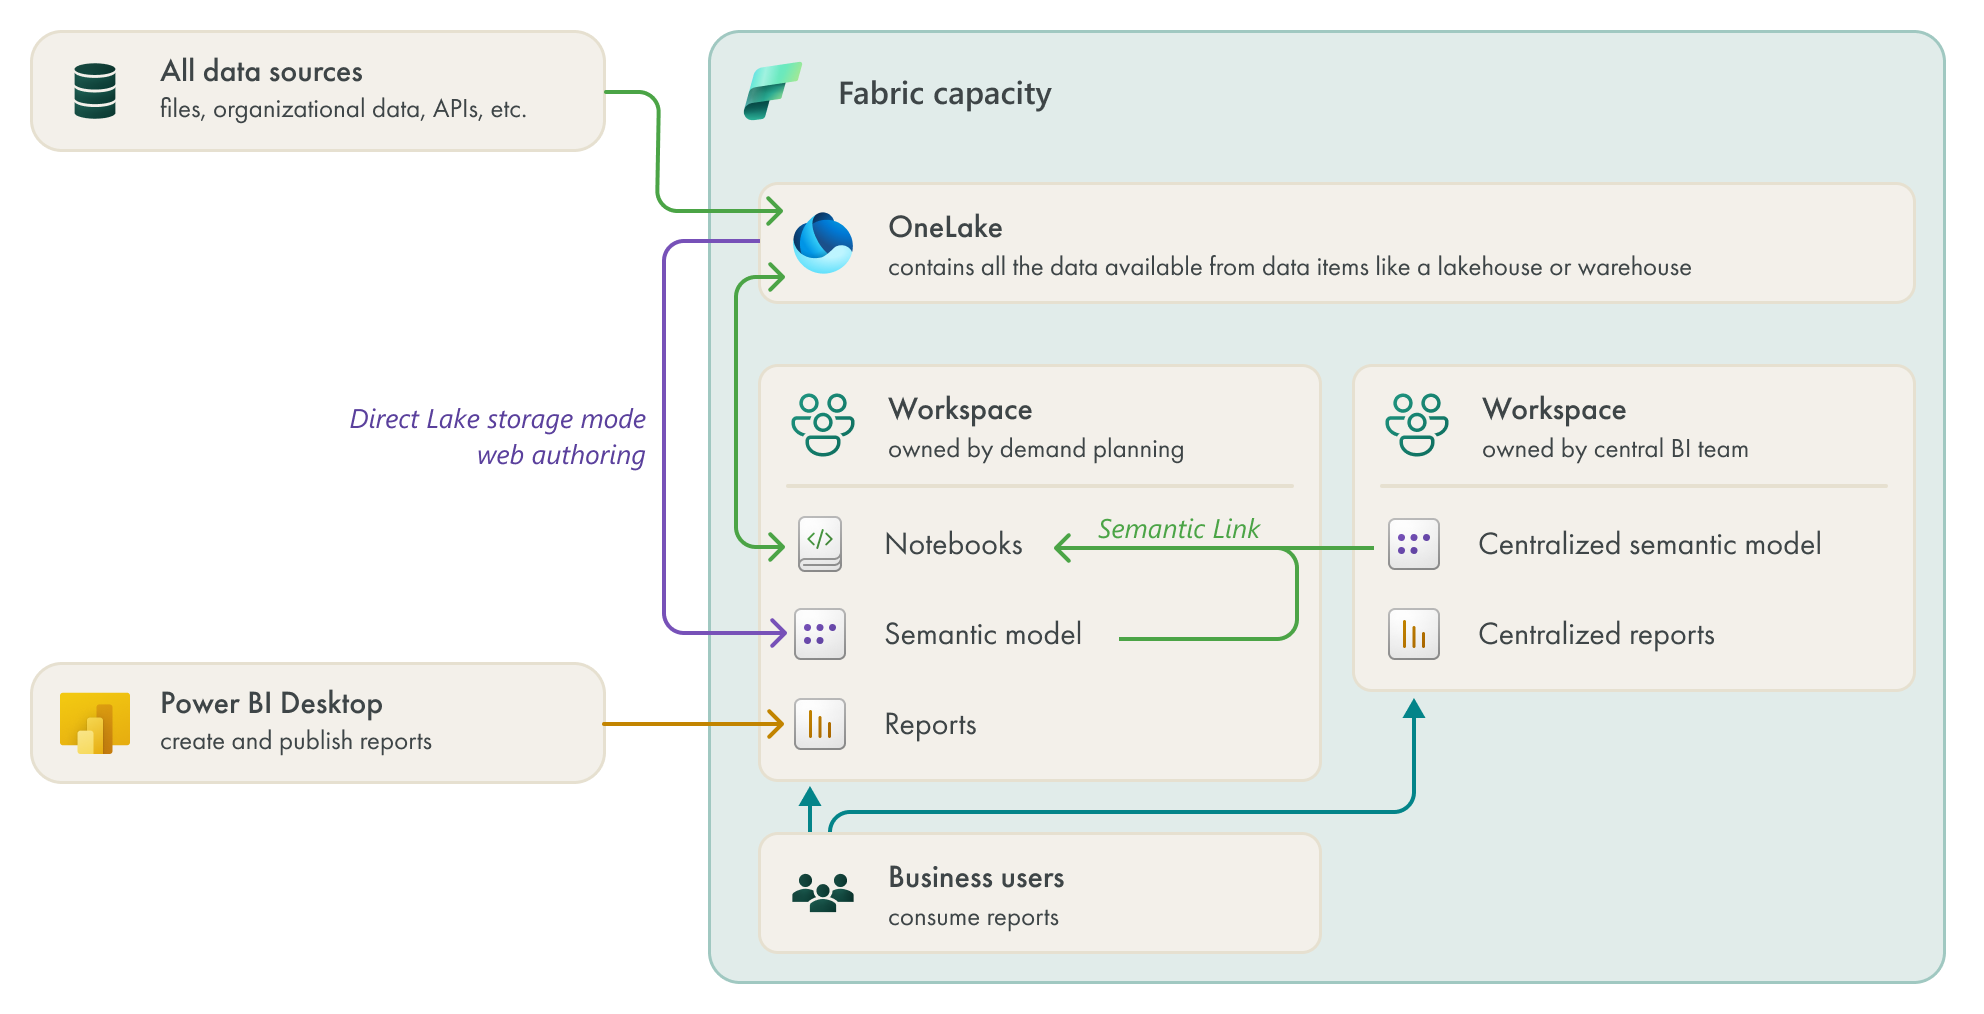
SCENARIO DIAGRAM: AFTER FABRIC
 What about lifecycle management and Git integration?:
Yes, this team ideally should be using multiple workspaces with deployment pipelines and Git integration. But they aren't. This is a business team who know very little about Git, and are working incrementally to deliver value and scale the maturity of their implementation.
In this initial diagram, I've excluded Git integration and multiple workspaces for simplicity. In a more mature implementation, this team would also be using Git integration for their models, reports, and notebooks, and deploying content between workspaces instead of directly deploying to a single workspace where the business consumes the content.
In general, this team got a lot of value from Fabric.

Data is centralized in OneLake and more easily findable and accessible. The team no longer has to perform exports; they can connect to and enrich existing data by using notebooks (where they can), and add new files by using the OneLake Explorer.
Notebooks allow them to better scale and collaborate their analyses. They can push their transformations from their semantic model upstream to their scheduled notebooks, now. This means they can kill their personal mode gateway! However, the team isn’t yet familiar with PySpark, it’s been easy for them to use and learn.
However, they need to be careful to manage their notebook schedules and CU usage. This is something new for this team, who are used to working locally and having no consequences for unperformant code. Unfortunately, it’s now a new point of conflict with the central BI team (it never ends).
Semantic link lets the team re-use logic in other semantic models, both for new analyses and to validate their existing analyses or models. It’s now much easier for the team to explore models and find data, then immediately use it, without having to be forced to use tools they aren’t comfortable with and exports that they don’t want to make and manage.
They can use Direct Lake to make simple semantic models from the data they prepare in notebooks. They still have to know data modeling and DAX to an extent, but this feels more lightweight for them and lets them leverage the semantic model without abusing it.
Their reports remain the same, so the business users only notice that the team is more agile and efficient.
It’s worth discussing some of these things in more detail, so the following sections contain select reproduced examples.
TRANSFORM DATA IN NOTEBOOKS AND DITCH THE PERSONAL MODE GATEWAY
The team now can transform data in notebooks and perform no transformations in Power Query at all, just getting the data with Direct Lake for their models and reports. Instead, they transform data in notebooks. This is very easy for them to do, and they can even add new local files by using the OneLake Explorer. Furthermore, they can eliminate the personal mode gateway, which is a win for everyone involved.
CONSUME AND ANALYZE SEMANTIC MODELS WITH SEMANTIC LINK
The team no longer have to perform exports or workarounds to analyze data from other semantic models (or their own). Now, they can use semantic link in notebooks. With a few lines of code, they can explore and retrieve data from a semantic model to use in their analyses. For this team, it’s particularly helpful, because they prefer the flexibility of seaborn visuals to visualize the results of their data. Usually, this is for ad hoc and one-off analyses, or validations.
This is a huge boon for them, especially because they can share and collaborate on these notebooks with each other.
New pains and considerations:
While this team certainly is getting value from Fabric, they also have run into some new things to consider:
- Notebook schedules and CU usage: The team is used to working locally, with no consequences of creating a mess (except for themselves). Now, however, they can impact their Fabric Capacity. Excited to explore the possibilities with their new notebooks, the team has been a bit liberal in their use and scheduling. This has been difficult for the central BI team to monitor and wrangle, and is currently a work-in-progress to wrangle under control.
- Workspace organization: Previously, the team had one workspace with a semantic model and a few reports. Now, that workspace already has many different item types, and dozens of notebooks. The team recognizes that they need to better plan and structure their workspaces so it's easier to govern their items and collaborate with their work They also need to agree on some better lifecycle management practices.
- Modeling and DAX: While the team thought that they'd be doing less modeling and DAX, their newfound agility has resulted in more Direct Lake models and reports they want to share with the business. They're also more frequently running into situations where they want to create DAX measures based upon analyses they did in notebooks, but they don't know how. So the team still needs to know DAX and data modeling, so long as they're serving out Power BI content.
- Governance: Because the team is going so fast with their notebooks, they're a bit eager to share results. This has led to over-sharing of some items, and more emailing of visuals and results from notebook analyses. The central BI team is discussing with the analysts the best way to sustainably deliver these results to the business without fanning these governance flames.

TO CONCLUDE
In this first scenario, a team proficient with R/Python was initially struggling to get value from Power BI. They lacked tools and features that supported their way of working. Fabric delivers this team tremendous value, as it contains items and features specifically intended for them. Now, they can leverage centralized data and collaborative notebooks to do their analyses. Semantic link is also a game-changer for them.
However, this team also has new considerations they need to manage with Fabric. For instance, they have to better manage their notebook CU usage and schedules, which isn’t something they’re used to thinking about. They also suddenly have to think about how to better structure their workspaces and collaborate in a sustainable way. They need to re-think the treadmilling they did before and slow down to define some more structured, sustainable practices to ensure they can commence a journey of incremental improvement.