All tagged Power BI Report
In this article, I explain several use-cases for semantic-link-labs with reports, which involves programmatic modifications to report metadata to streamline certain report management tasks. This article explains how to do this with standard reports; future articles will elaborate about using the methods available for PBIR.
In this article, I introduce semantic-link-labs, a library based upon semantic-link that you can use in Microsoft Fabric notebooks to help you build, use, manage, and audit not only semantic models, but also reports and other items or parts of Fabric.
Power BI is a powerful tool that has also enabled millions of people worldwide to easily visualize & explore their data. Despite that, inflexibility to the visualization configuration and formatting can make it difficult to fulfill visual requirements. What are some of the biggest feature gaps with data visualization in Power BI, and why is this important?
In this post I list some tips for checking to make sure your report is ready for handover to someone else.
In this article, I discuss 3 common approaches to collecting reporting requirements, arguing in favor of the third approach - working iteratively & collaboratively with business users to make the report.
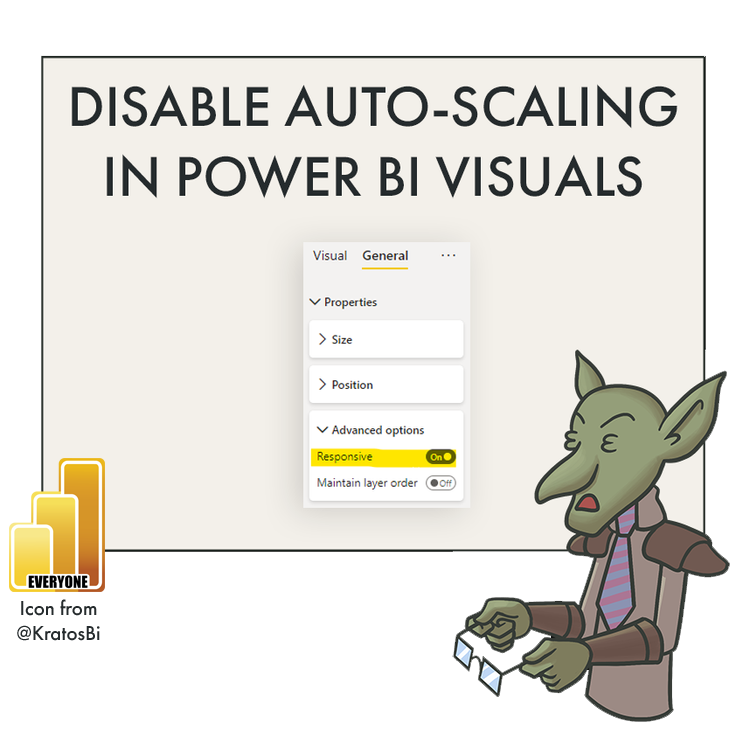
‘Responsive Visuals’ is a lesser-known feature that in general helps users make better graphs without fawning over visual settings & parameters. However, disabling it might be necessary at times when you are trying to achieve a specific result that Power BI default visuals won’t seem to permit.
In this post, I write about the options for self-service tooling in Power BI. Which tools to use for which cases, by whom & why? I've found it's helpful to visualize the different dimensions of this, to know the options & understand user skill/solution paths.
pbi-tools is a command-line tool that enables Source / Version Control of Power BI (thin) reports and datasets. Much like the folder structure generated by Tabular Editor, pbi-tools creates a Report Layout structure based on files in the .pbix. In these articles, we go into the background of this tool & how to use it.
An important note if you are using Sensitivity Labels - files with Sensitivity Labels are currently not supported with pbi-tools. More info on that at the bottom of the article.
The default Cards & KPI visuals are frequently the first visual a report user will see. It is thus important that they contain meaningful values. Unfortunately, for many users, a (Blank) is not meaningful, either because it is not understood, or they expect to see 0, instead. Here I explain how you can easily hide these blanks with conditional formatting, or a few methods to replace the (Blank) with 0.
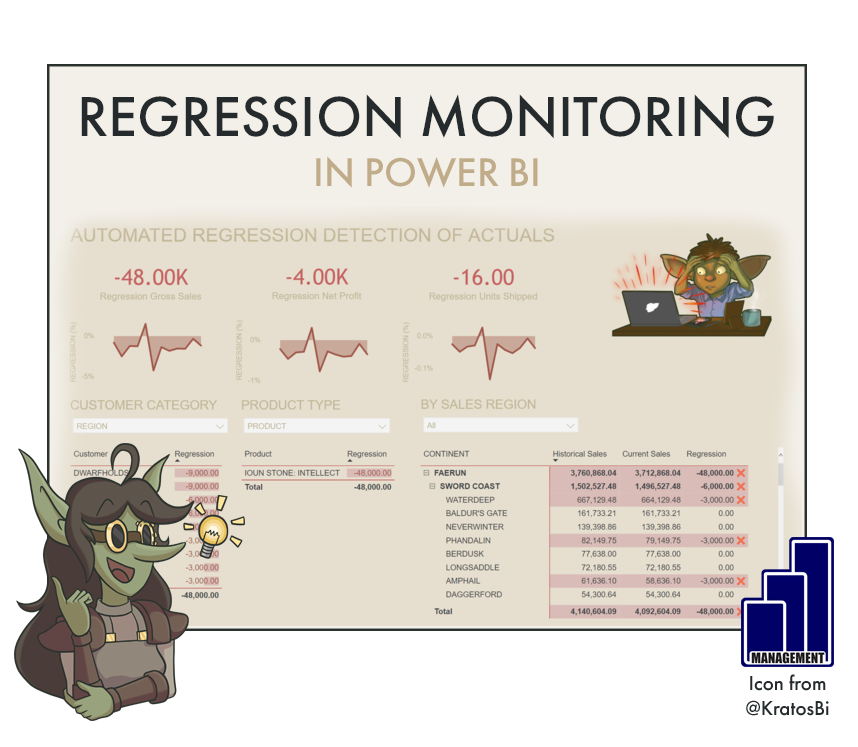
In this article, we examine a method to automatically monitor & test data quality in Power BI by setting up a composite model to detect data changes.
In this article we look at how to get Microsoft Tasks / Planner data into Power BI, to make analytical reports from our operational Planner boards.
In this article we look at a method for creating waffle charts in Power BI with the default visuals.
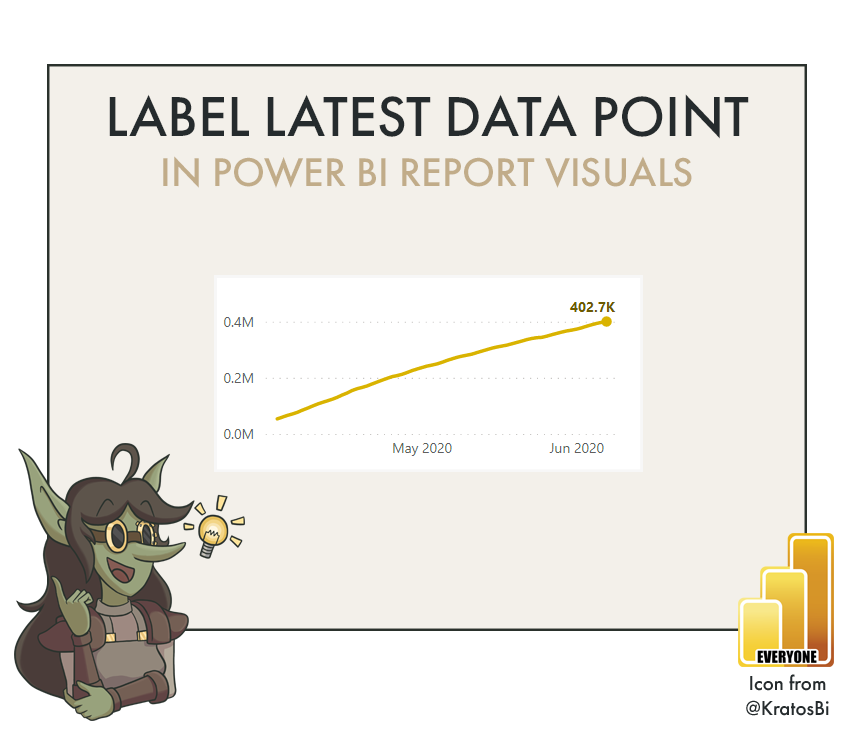
In this article, we look at a method to format a single data point in a Power BI visual. Specifically, we look how to label the latest data point in a line chart. This method also works with individual formatting of other data points.
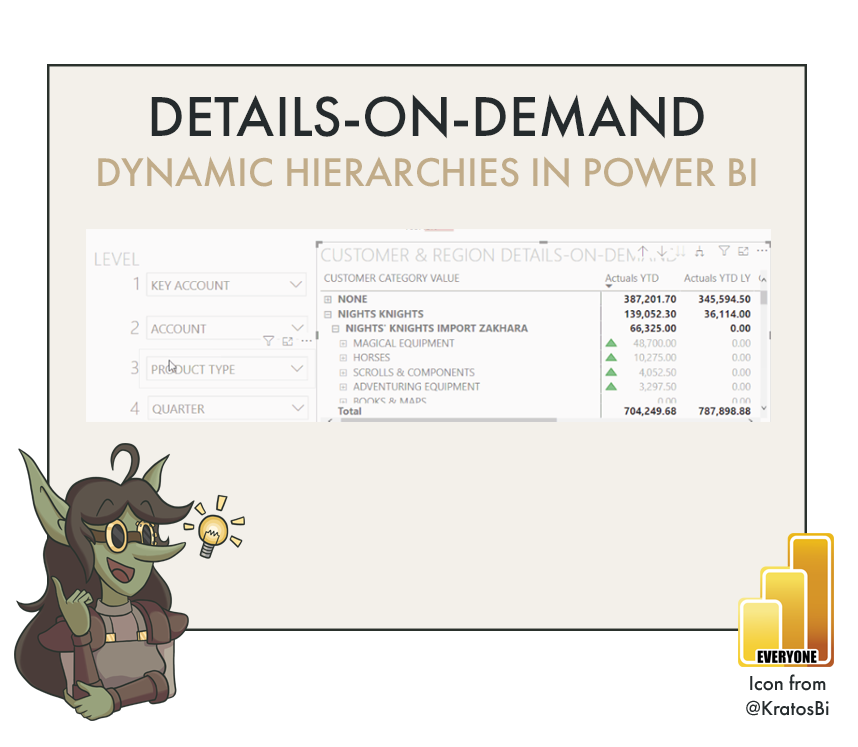
In this article we examine a method to create dynamic hierarchies in Power BI. This is particularly useful for creating ‘details-on-demand’ matrixes; interactive pivot tables in Power BI.
In this article, we look at a way of creating a folder-tab navigation experience using the KPI and Card visuals. Users click on the KPI or Card and then get more details for that metric.