It’s frustrating that in Power BI re-naming measures or moving them to another table will break any visuals using them in reports. Likewise, Power BI does not have a feature to hot-swap measures in visuals, to retain formatting or save time. Here I will show you an easy way to replace multiple measures in a Power BI report, including those used in “broken” visuals. Fix all broken visuals in Power BI reports using this method!
Plenty to read!
-
December 2024
- Dec 28, 2024 Recover Power BI reports or models that you can’t download Dec 28, 2024
- Dec 13, 2024 An update about articles on data-goblins.com Dec 13, 2024
-
October 2024
- Oct 1, 2024 Fix visuals, replace fields, and mass-format reports in Power BI Oct 1, 2024
- Oct 1, 2024 Managing Power BI reports or models using semantic-link-labs Oct 1, 2024
-
September 2024
- Sep 5, 2024 Myths, Magic, and Copilot for Power BI Sep 5, 2024
-
April 2024
- Apr 16, 2024 Fabric is a team sport Apr 16, 2024
-
February 2024
- Feb 27, 2024 What Microsoft Fabric means for your semantic models: New options and approaches Feb 27, 2024
- Feb 27, 2024 What Microsoft Fabric means for your semantic models: Scenario 1 Feb 27, 2024
- Feb 27, 2024 What Microsoft Fabric means for your semantic models: Scenario 2 Feb 27, 2024
- Feb 27, 2024 What Microsoft Fabric means for your semantic models: Scenario 3 Feb 27, 2024
-
January 2024
- Jan 30, 2024 Fix Power BI “Something is wrong with one or more fields” Jan 30, 2024
- Jan 4, 2024 The Quality Problem: A Call-to-Arms Jan 4, 2024
-
December 2023
- Dec 19, 2023 Need some more goblins? Dec 19, 2023
-
October 2023
- Oct 18, 2023 Case-sensitive models in Power BI: consequences & considerations Oct 18, 2023
- Oct 17, 2023 How to use Tableau with Power BI and Fabric Oct 17, 2023
- Oct 8, 2023 Does it feel like too much? Oct 8, 2023
-
September 2023
- Sep 5, 2023 KPIs and cards in Power BI Sep 5, 2023
-
August 2023
- Aug 29, 2023 How to set table or matrix column widths in a Power BI report Aug 29, 2023
- Aug 22, 2023 Analyze Video Game Data for Personal Data Projects Aug 22, 2023
- Aug 2, 2023 Solve the Right Problems Aug 2, 2023
- Aug 1, 2023 Format Power Query in Power BI (Updated) Aug 1, 2023
-
July 2023
- Jul 28, 2023 Basic Line Charts in Power BI Jul 28, 2023
- Jul 26, 2023 Bar Charts in Power BI Jul 26, 2023
- Jul 11, 2023 Playing Dungeons & Dragons was the best thing I did for my Power BI career Jul 11, 2023
-
May 2023
- May 28, 2023 DAX.do quiz May 28, 2023
- May 24, 2023 Overview of new Microsoft Fabric Power BI Announcements May 24, 2023
-
April 2023
- Apr 25, 2023 How to unlock new features in Power BI datasets managed with Tabular Editor Apr 25, 2023
- Apr 4, 2023 How to manage “Reporting Objects” in a Power BI Dataset Apr 4, 2023
-
March 2023
- Mar 7, 2023 Learn Tabular Editor with a Quiz (using a C# Script / Macro!) Mar 7, 2023
- Mar 3, 2023 Snek! The First Video Game for Tabular Editor 3. Mar 3, 2023
-
February 2023
- Feb 28, 2023 “It Depends” - Power BI Best Practices & Optimizations Feb 28, 2023
- Feb 14, 2023 Check & Query Data from Tabular Editor Feb 14, 2023
- Feb 7, 2023 Smart Buttons & Power BI Reporting Feb 7, 2023
-
January 2023
- Jan 5, 2023 Run Tabular Editor Macros with Keyboard Shortcuts & Toolbar Buttons Jan 5, 2023
- Jan 5, 2023 Count Measures in Power BI Datasets with Tabular Editor Jan 5, 2023
- Jan 3, 2023 Advance Your Career & Learning with Data Communication Jan 3, 2023
-
December 2022
- Dec 27, 2022 Learn Power BI with Sample Datasets: Part 2 - Personal Data Projects Dec 27, 2022
- Dec 20, 2022 Learn Power BI with Sample Datasets: Part 1 - Contoso Data Generator Dec 20, 2022
-
November 2022
- Nov 15, 2022 Power BI Analyze-in-Excel Checklist Nov 15, 2022
- Nov 8, 2022 Measure Selection in Power BI Nov 8, 2022
-
October 2022
- Oct 25, 2022 The Data Café - A Secret Sauce for Adoption Oct 25, 2022
- Oct 18, 2022 Converting a Power BI Dataset .bim to a .pbix with pbi-tools Oct 18, 2022
- Oct 18, 2022 Power BI App Checklist Oct 18, 2022
- Oct 18, 2022 Power BI Dashboard Checklist Oct 18, 2022
- Oct 18, 2022 Power BI Dataflow Checklist Oct 18, 2022
- Oct 4, 2022 Power BI Data Visualization - Ideas & Wishlist Oct 4, 2022
-
September 2022
- Sep 6, 2022 Exploring App Audiences in Power BI Sep 6, 2022
- Sep 1, 2022 Power BI Dataset Checklist Sep 1, 2022
- Sep 1, 2022 Power BI Report Checklist Sep 1, 2022
-
August 2022
- Aug 30, 2022 Designing Models and Reports for your Future Self: Part 1 Aug 30, 2022
- Aug 23, 2022 You can do this, dammit Aug 23, 2022
-
July 2022
- Jul 28, 2022 Looking for your input for a future session about Mental Health Jul 28, 2022
- Jul 26, 2022 Training Power BI End-Users with reporTee Jul 26, 2022
- Jul 19, 2022 “We need this report in Power BI” Jul 19, 2022
- Jul 5, 2022 Disable Auto-scaling in Power BI Visuals Jul 5, 2022
-
June 2022
- Jun 28, 2022 Visualize Power BI Dependencies with Tabular Editor and Mermaid Jun 28, 2022
- Jun 21, 2022 Dimensions of Self-Service in Power BI: Part 2 - The Dimensions of Learning Jun 21, 2022
- Jun 21, 2022 The Impact Factor of Power BI External Tools Jun 21, 2022
- Jun 14, 2022 Dimensions of Self-Service in Power BI: Part 1 Jun 14, 2022
- Jun 7, 2022 The value Power BI could bring to Academic Research Jun 7, 2022
-
May 2022
- May 31, 2022 Sci to BI - Similarities between Science & Business Intelligence May 31, 2022
- May 24, 2022 Can't Enable Audit Log in Office Compliance Portal May 24, 2022
- May 17, 2022 Monitoring Power BI using REST APIs from Python May 17, 2022
- May 10, 2022 Fix Visuals or Replace Measures in Power BI Reports using pbi-tools May 10, 2022
- May 9, 2022 Get Power BI Dataset Refresh History using Python May 9, 2022
- May 8, 2022 Get Publish-to-Web & Org. share links from Power BI API with Python May 8, 2022
- May 7, 2022 Get Workspaces from Power BI API with Python May 7, 2022
- May 6, 2022 Get Deployment Pipelines from Power BI API with Python May 6, 2022
- May 5, 2022 Formatting Code for Blogs & Websites May 5, 2022
- May 1, 2022 Running PowerShell from a Python GUI May 1, 2022
-
April 2022
- Apr 19, 2022 Extracting Power BI Tenant Settings with Power Automate Desktop Apr 19, 2022
- Apr 12, 2022 Adding tables in Power Query using Tabular Editor Apr 12, 2022
- Apr 5, 2022 Track Changes in Power BI: Part 5 - Using pbi-tools Apr 5, 2022
-
March 2022
- Mar 29, 2022 Track Changes in Power BI: Part 4 -Reports Mar 29, 2022
- Mar 15, 2022 Assess an Existing Dataset with Tabular Editor 3 - Part 3: Extend DMVs with C# Scripts & Macros Mar 15, 2022
- Mar 8, 2022 Assess an Existing Dataset with Tabular Editor 3 - Step 2: Query DMVs Mar 8, 2022
- Mar 1, 2022 Analyze a Dataset with Tabular Editor 3 - VertiPaq Analyzer Mar 1, 2022
-
February 2022
- Feb 22, 2022 The Goblin Behind the Model Feb 22, 2022
- Feb 15, 2022 How to Analyze YouTube & YouTube Music History with Power BI (or Excel) Feb 15, 2022
- Feb 8, 2022 View & Edit Power Query in Tabular Editor Feb 8, 2022
- Feb 1, 2022 Track Changes in Power BI: Part 3 - Workspace Mode Feb 1, 2022
- Feb 1, 2022 Track Changes in Power BI: Part 2 - Tutorial Feb 1, 2022
- Feb 1, 2022 Track Changes in Power BI: Part 1 - Introduction Feb 1, 2022
-
January 2022
- Jan 25, 2022 A Beginner's Guide to Tabular Editor 3: UI Customization & Code Assist Features Jan 25, 2022
- Jan 20, 2022 How to create an Azure DevOps Repo using Git & Visual Studio Jan 20, 2022
- Jan 18, 2022 How to hide blanks in Cards & KPI visuals in Power BI, easily Jan 18, 2022
- Jan 11, 2022 Tabular Editor - Which License is Right for You? An Interactive Guide. Jan 11, 2022
- Jan 4, 2022 Tabular Editor – Supercharge your Power BI Development Jan 4, 2022
-
December 2021
- Dec 28, 2021 Format all DAX in your model at once with Tabular Editor Dec 28, 2021
-
March 2021
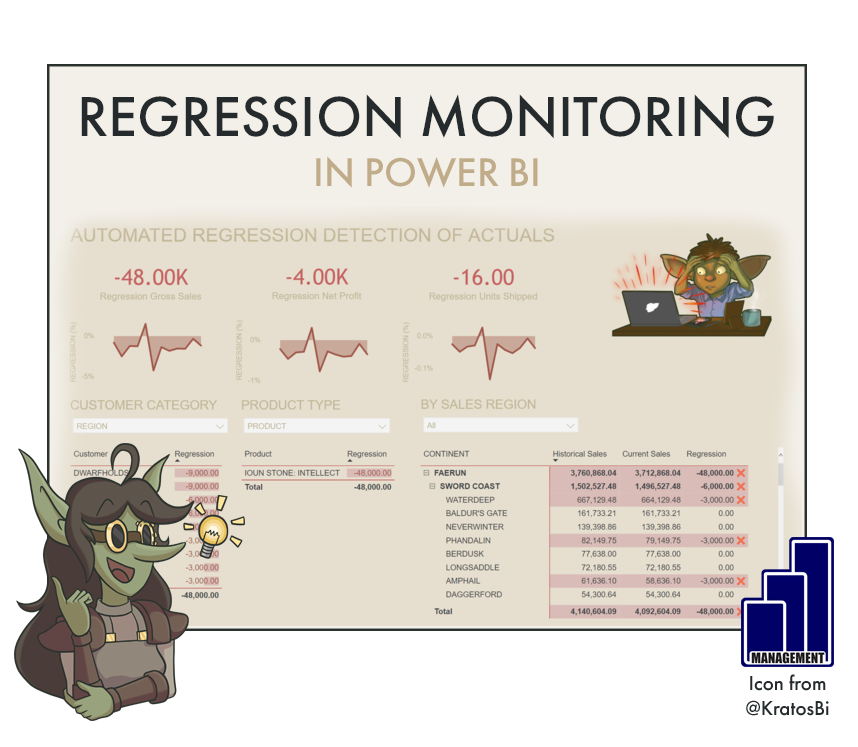
- Mar 2, 2021 Automated Regression Monitoring in Power BI Mar 2, 2021
-
February 2021
- Feb 16, 2021 Visualizing Microsoft Planner & Tasks data in Power BI Feb 16, 2021
-
October 2020
- Oct 17, 2020 How to make effective slope charts in Power BI Oct 17, 2020
- Oct 10, 2020 How to make a Waffle chart without custom visuals in Power BI Oct 10, 2020
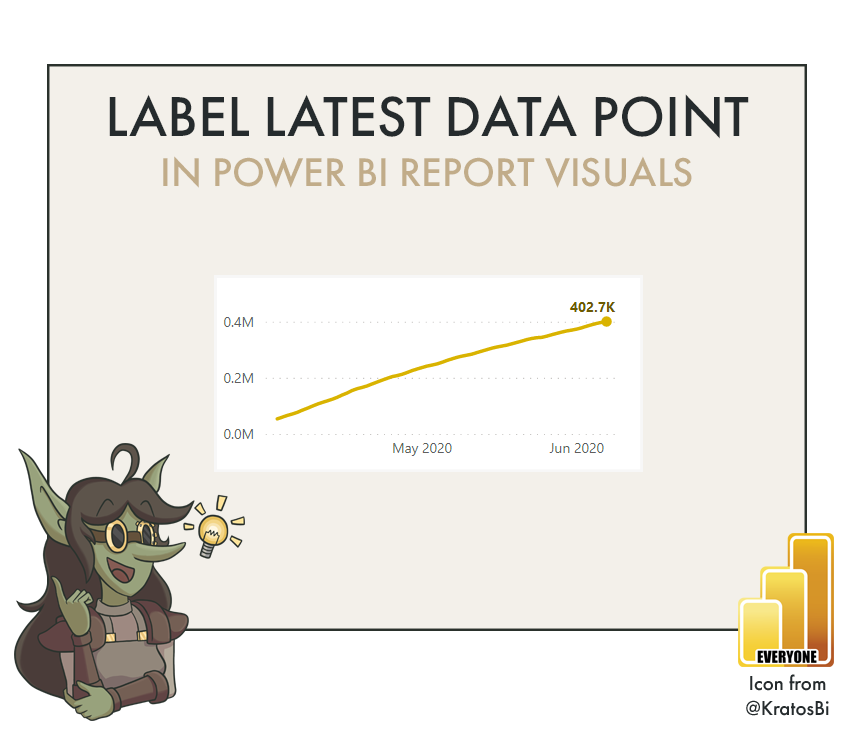
- Oct 6, 2020 How to label the latest data point in a Power BI line or area chart Oct 6, 2020
-
September 2020
- Sep 15, 2020 Selectable dimensions in Power BI Sep 15, 2020
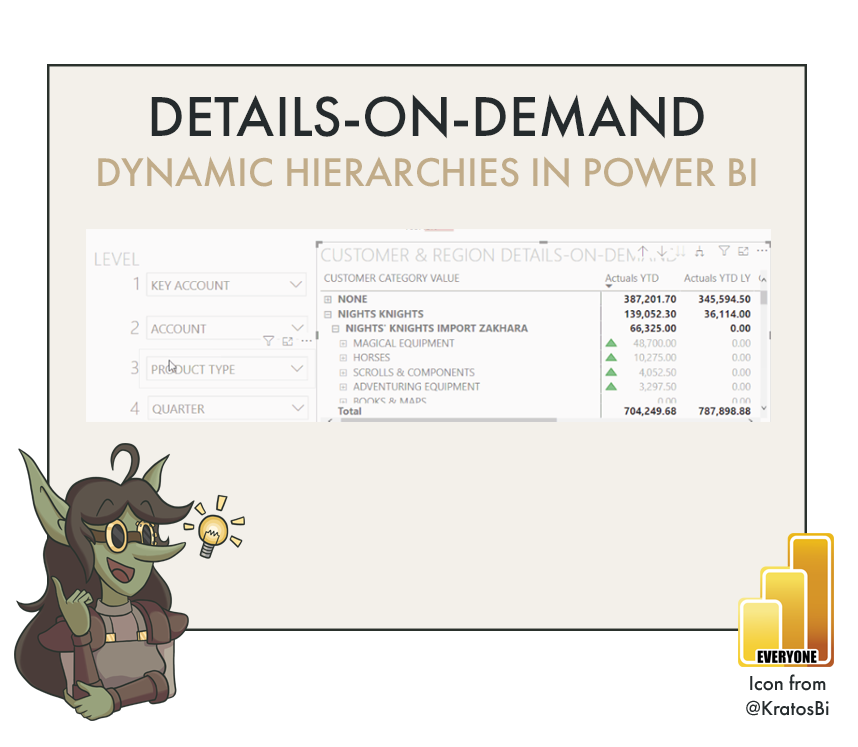
- Sep 8, 2020 What are 'Details-on-Demand' matrixes in Power BI? Sep 8, 2020
-
August 2020
- Aug 25, 2020 KPI Tab page navigation in Power BI Aug 25, 2020


