In this article, I explain several approaches to recover models and reports from a Power BI workspace when the Download this file (.pbix) option is greyed out. These methods involve use of either external tools or a Fabric notebook.


Plenty to read!
In this article, I explain several approaches to recover models and reports from a Power BI workspace when the Download this file (.pbix) option is greyed out. These methods involve use of either external tools or a Fabric notebook.
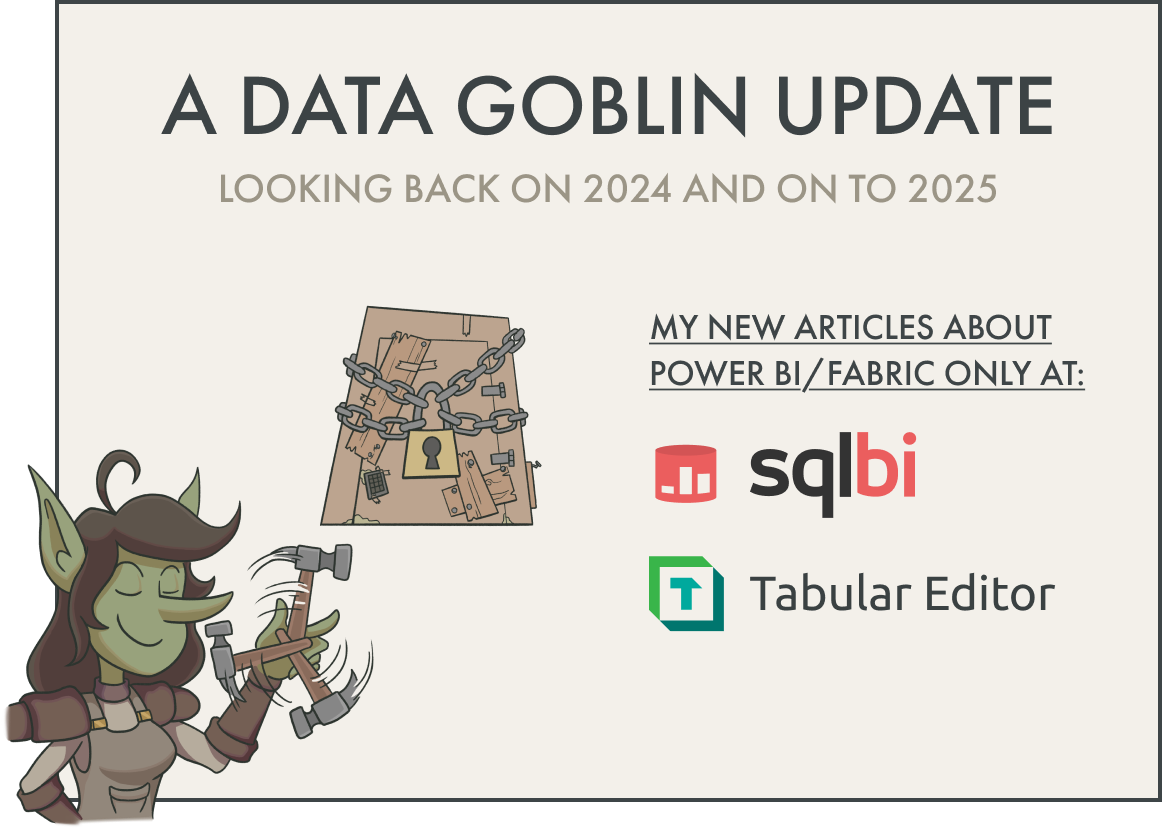
In this post I share that I won’t publish articles about Power BI and Fabric on data-goblins.com anymore, focusing my efforts on content for Tabular Editor and SQLBI.
In this article, I explain several use-cases for semantic-link-labs with reports, which involves programmatic modifications to report metadata to streamline certain report management tasks. This article explains how to do this with standard reports; future articles will elaborate about using the methods available for PBIR.
In this article, I introduce semantic-link-labs, a library based upon semantic-link that you can use in Microsoft Fabric notebooks to help you build, use, manage, and audit not only semantic models, but also reports and other items or parts of Fabric.
In this article, I explain Copilot in Fabric and Copilot in Power BI, walking through what it is, how it works, and three common scenarios when it might be used. More importantly, I evaluate whether using it over other, non-AI approaches makes sense, and evaluate the current state.
In this article, I share some unfiltered thoughts about why it’s unrealistic to expect one person to know everything in Fabric, and concerns I have about unrealistic expectations being put in the market regarding Fabric.
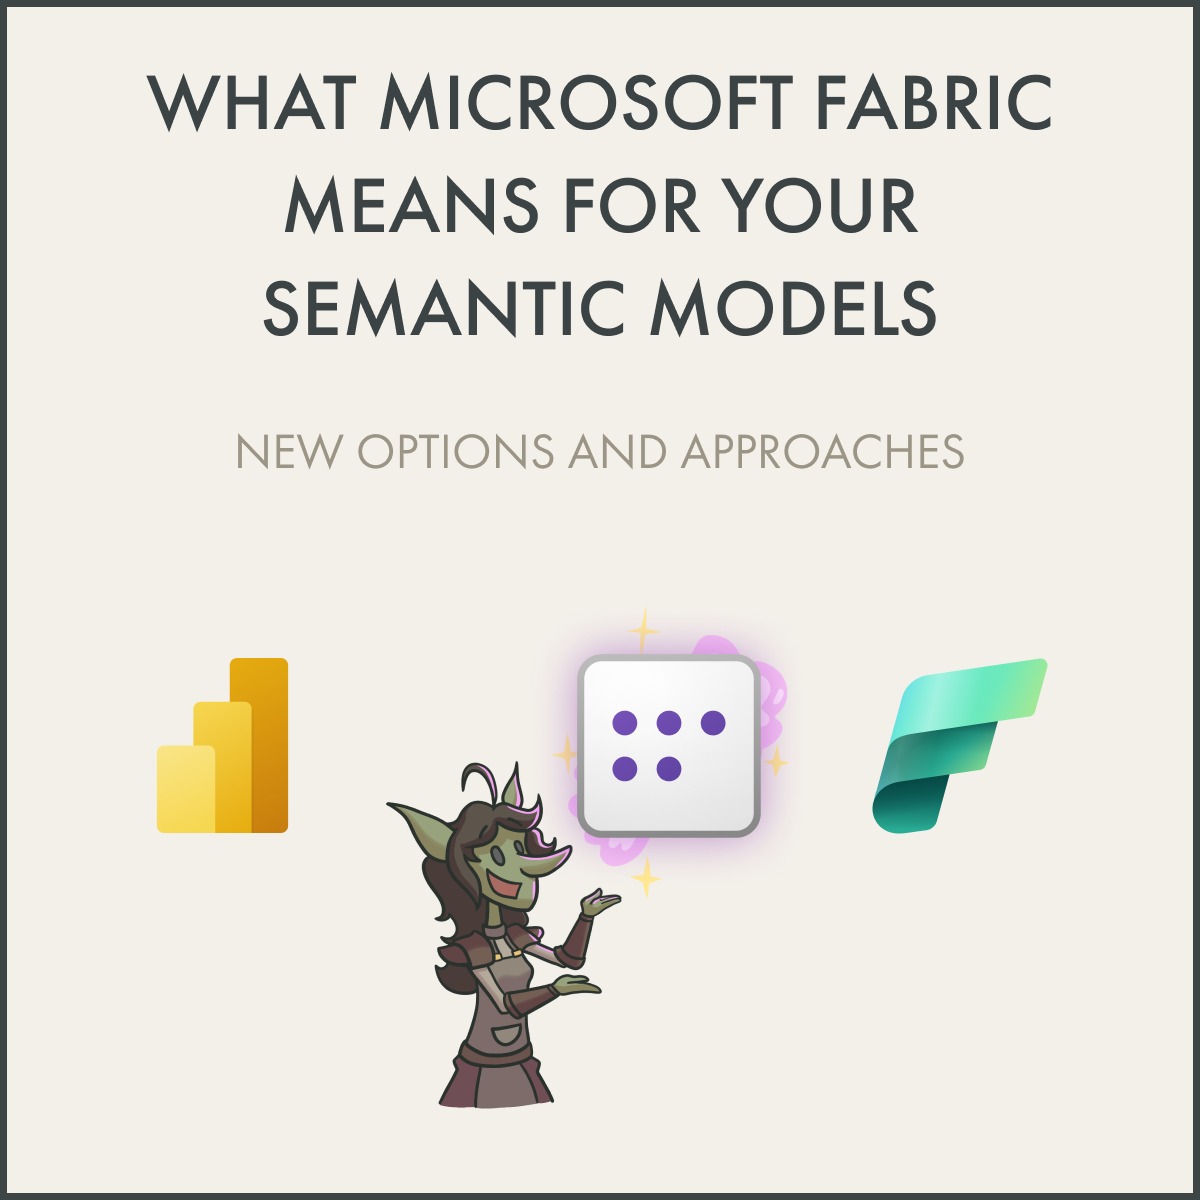
In this article, I explain what it means for your current and future semantic models if you choose for Fabric. This post isn’t meant to market Fabric to you; it’s purely informative.
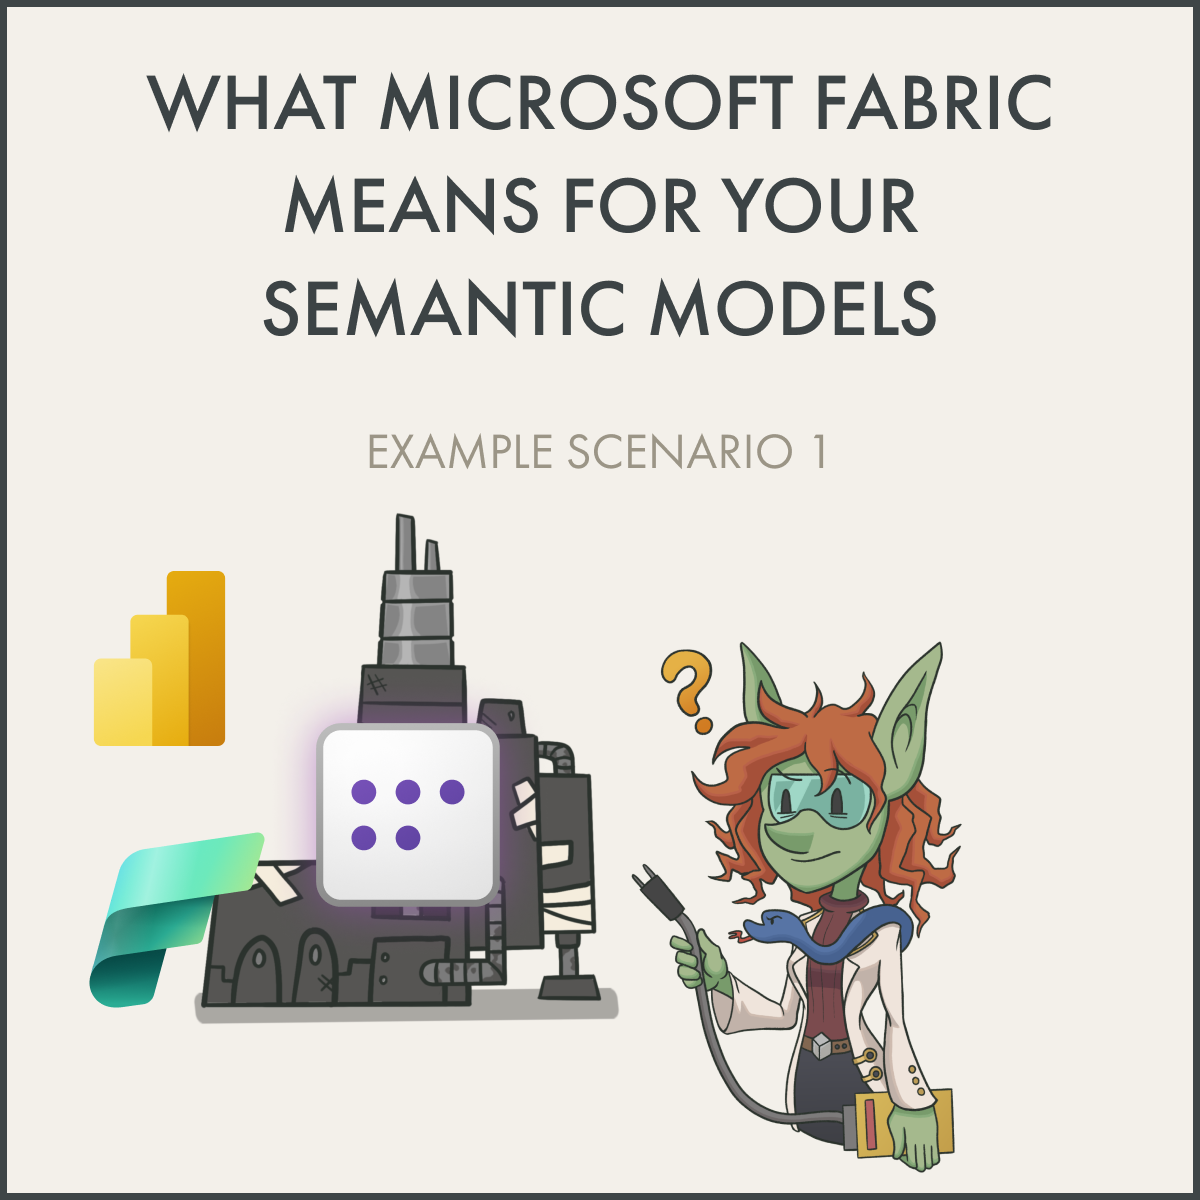
In this article, I illustrate one example of how a team goes from using a semantic model in Power BI (Pro) to Fabric.
In this article, I illustrate an example of how a departmental analytics team goes from using a semantic model in Power BI to Fabric.
In this article, I illustrate an example of how an enterprise BI team takes their model from Power BI to Fabric.
In this article, we look at a 5-step process to replace fields in a report when you’ve re-named, moved, or deleted them in the model. You can also use this method to “hot swap” different fields in and out of a visual without losing formatting. This isn’t officially supported, but it’s easy and it’s a huge time-saver.
In this article, I discuss why quality is a often problem for data and analytics, and how DataOps can help.
This short update shares some content I've published elsewhere this year which you might find helpful.
In this short article, we look at the consequences of having a case-specific collation in your Power BI semantic model. This is particularly important as Direct Lake models created in the Fabric user experience have a case-sensitive collation applied, automatically.
In this post, I’ll explain the how and why of:
How to connect Tableau to Power BI semantic models.
How to connect Tableau to Fabric lakehouses (and other items that have a SQL endpoint).
If you feel like the pace and volume of updates surrounding Power BI have increased, you’re not alone. In this article, I discuss why many people feel like “it’s just too much” lately, why that’s a problem, and what we might do about it.
In this collaboration with Štěpán Rešl, I share some tips and templates to design effective KPI visuals.
In this article, I share a quick and easy way to manually set table and matrix column widths in Power BI by using the new Power BI Projects (.pbip) file format. This is an unsupported feature, but it works reliably.
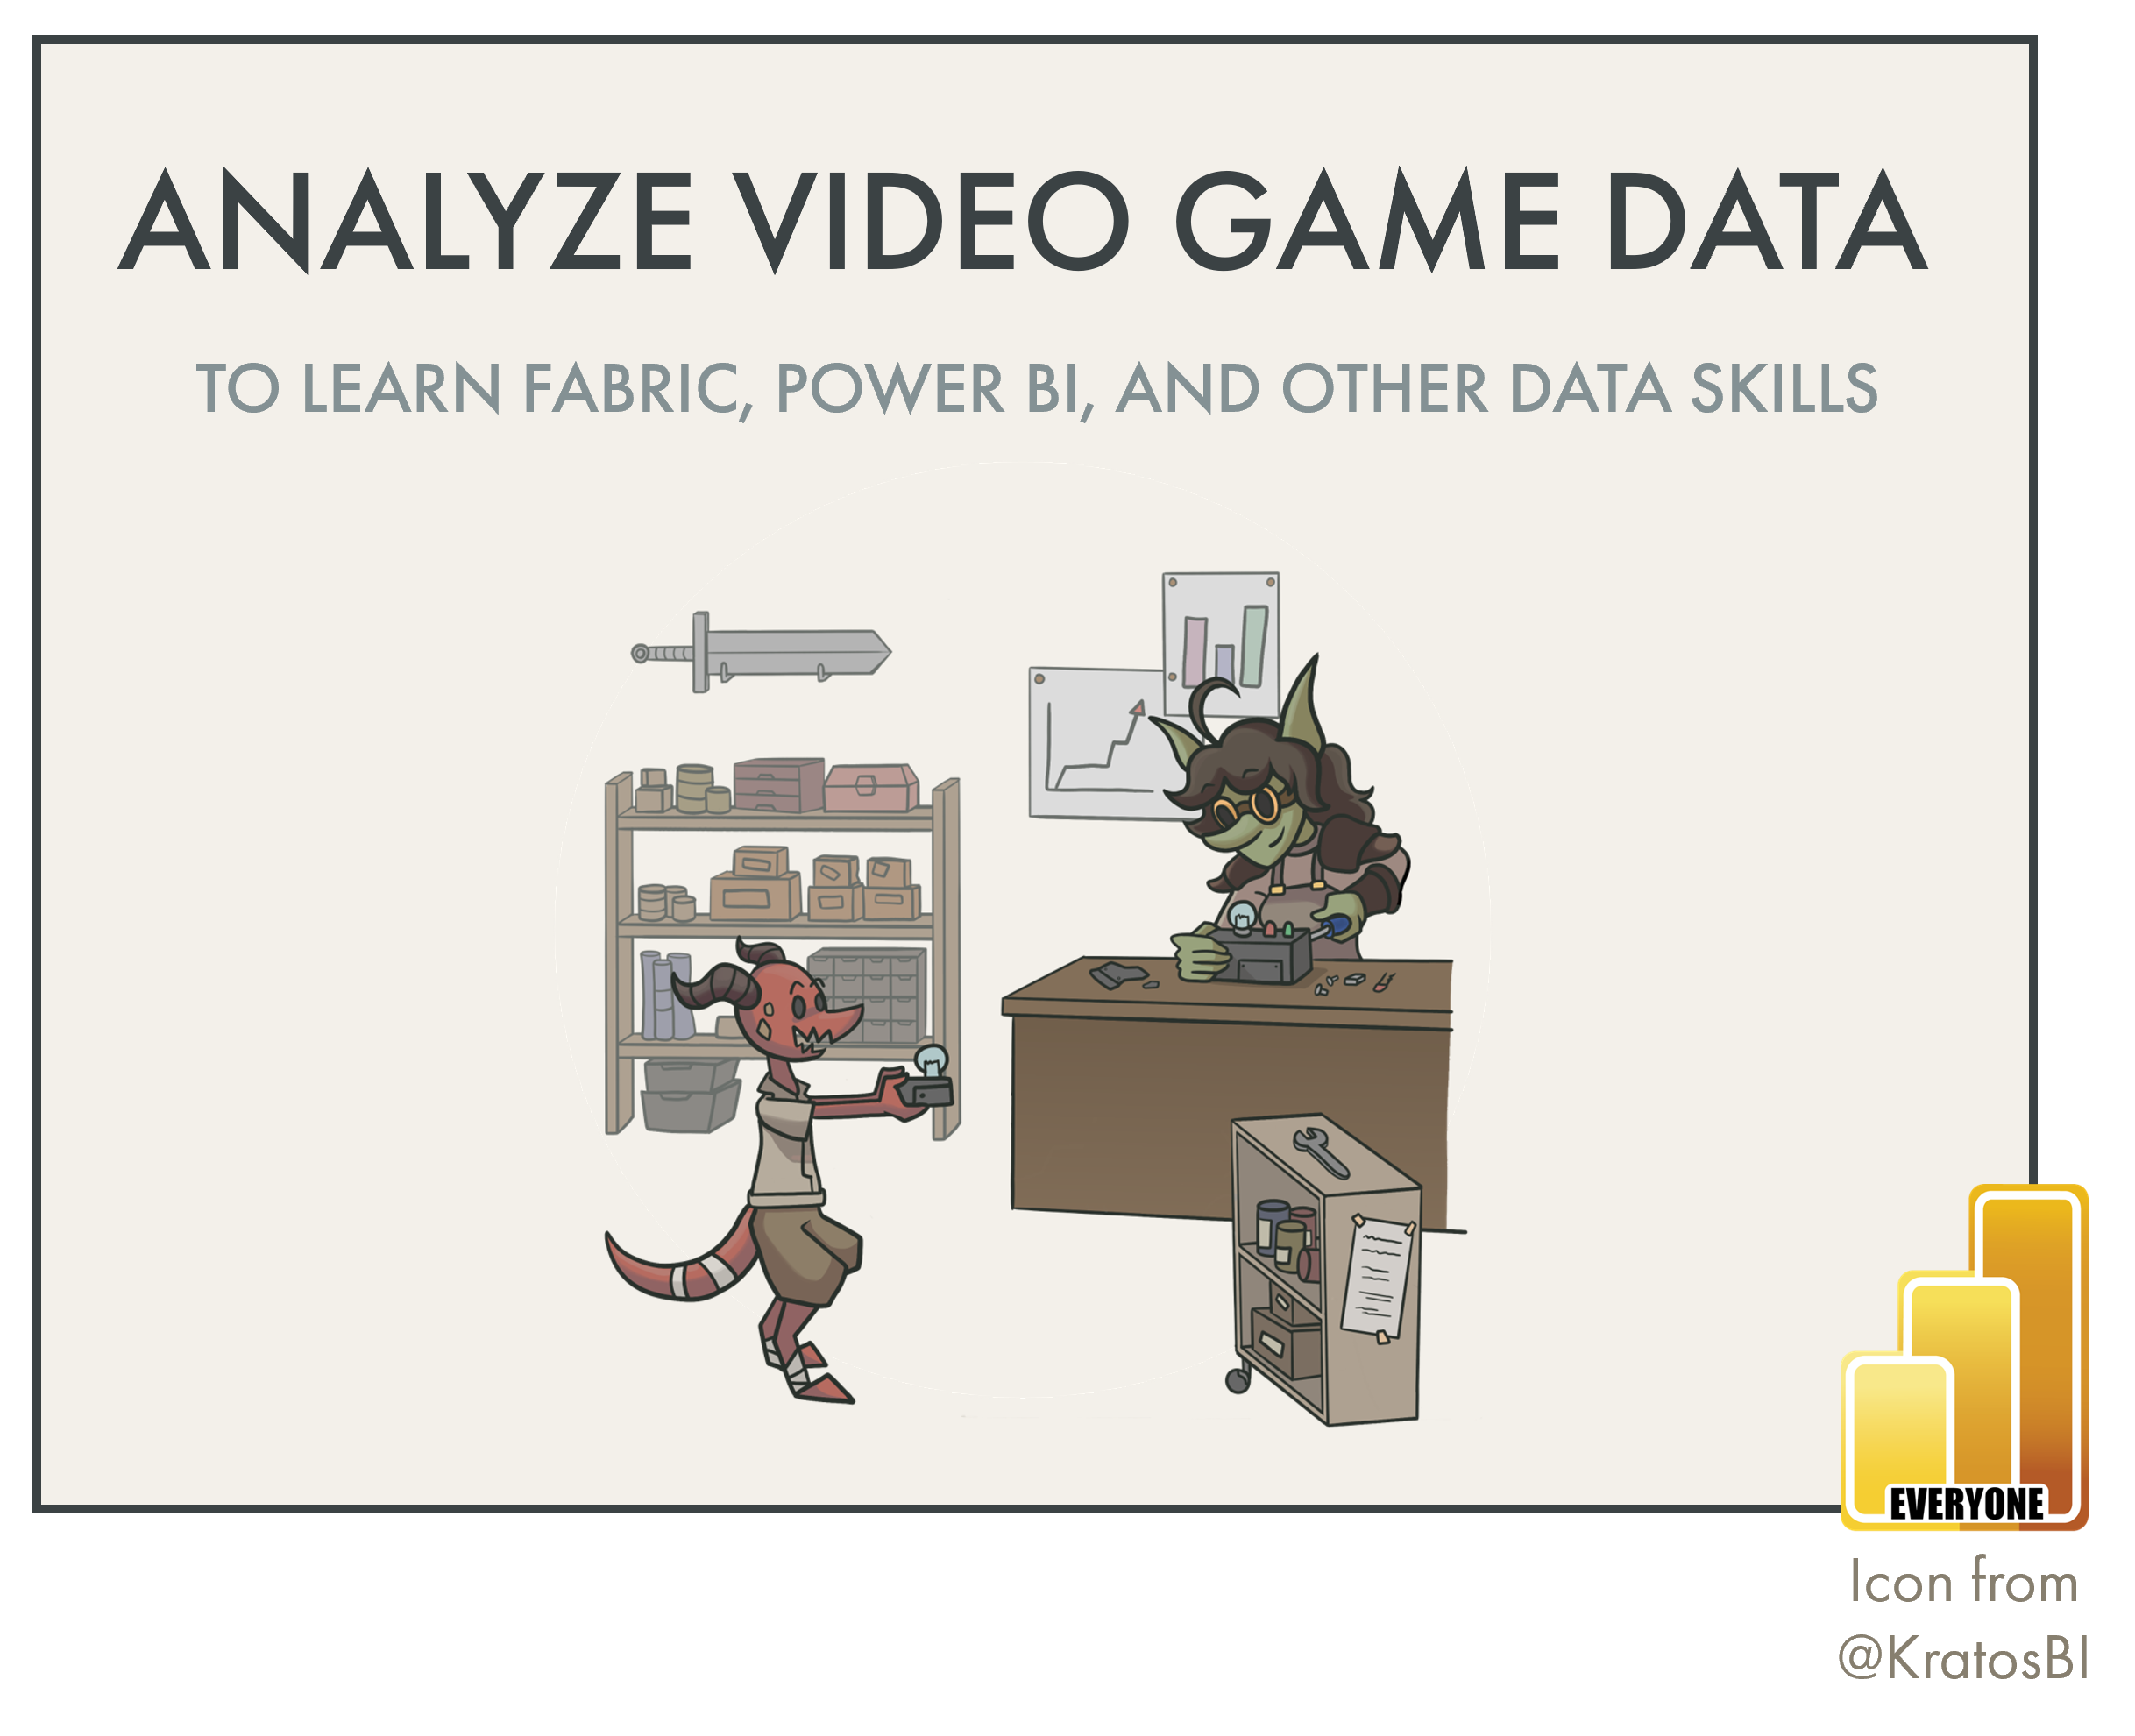
In this article, we examine why video games provide the perfect data sources for learning Fabric, Power BI, and honing your data skills, in general.
In this article, we discuss how we might have more impact and deliver more value with data and analytics by shifting our mentality from a focus on technical problems to equal focus on technical, business and adoption problems.