

Power BI Analyze-in-Excel Checklist

IMPLEMENTING ANALYZE-IN-EXCEL
Best practices for ensuring adoption & governance of Analyze-in-Excel in your organization…
🔮 PART 1: HANDOVER OF DATASETS & REPORTS
CHECKLISTS
📝 PART 2: MODEL / DATASET
📝 PART 3: DATAFLOW
📝 PART 4: REPORT
📝 PART 5: DASHBOARD
📝 PART 6: APP CHECKLIST
📝 PART 7: ANALYZE-IN-EXCEL 👈
📝 TBD: ON-PREMISES DATA GATEWAY
📝 TBD: DEPLOYMENT PIPELINE
📝 TBD: PAGINATED REPORT
📝 TBD: METRICS (FORMERLY GOALS)
📝 TBD (After GA): DATAMART
LEVERAGING POWER BI FROM EXCEL

With just a few clicks, one can connect to and analyze Power BI data from an Excel pivot table. While straightforward, this elegance is sometimes mistaken for oversimplicity; implementation of Analyze-in-Excel usually focuses on dataset content and access, neglecting how the tool should be adopted & governed. Further, a painful truth is that Analyze-in-Excel can occasionally be an over-used bandage to address Excel-based or data export requests rather than addressing the root business question/problem that users have. Making the most of Analyze-in-Excel means treating it as a part of our self-service toolkit. To do so effectively, we must understand its use-cases, support adoption & create a governance model around it.
In this article — targeting Power BI center-of-excellence members or Power BI decision-makers — we examine considerations for an Analyze-in-Excel solution. We’ll walk through the adoption & governance points important to consider, while concluding with the documentation & training steps that should be followed. Specifically, we reflect upon the below questions:
Is this the right solution for our business data problem?
How can we enable users while mitigating governance risk?
How can we improve the experience; ensure it’s used, and used properly?
What should be documented from an ‘Analyze-in-Excel’ solution?
How do we adequately train users to get value from this?
IS ANALYZE-IN-EXCEL THE RIGHT SOLUTION FOR THIS PROBLEM?
DEFINING THE USERS
Who will use Analyze-in-Excel in our organization today? Answering this question is a key first step to understanding how it will be used to derive business value. This is best done by engaging with representative user groups or individuals, demonstrating the tool and discussing how they might use it. Engaging with users helps avoid making incorrect assumptions & generalizations, which may lead to poor governance decisions difficult to change, later. Below are examples of questions to address when considering who are the end-users of Analyze-in-Excel:
| Example Questions | Relevance |
|---|---|
| How do they consume organizational data, today? Do they do their own analyses? |
- Identify the need for self-service or report consumption |
| What actions do they take based on data and what do they need to take those actions (kind of data, freshness, flexibility...)? | - Defining user needs & context for the data they use |
| Are they aware of Analyze-in-Excel? Are they using Analyze-in-Excel, already? |
- Learn from user experiences - View existing uses of Analyze-in-Excel |
| Do they presently export data from Power BI visuals? If so, why? |
- Analyze-in-Excel may provide them a more efficient & secure way to do this |
| What is their skill level with Excel, Pivot Tables & related features/functionalites? | - Segmenting users by skill - Defining early training efforts - Identifying opportunities for advanced features like Detail Row Expressions or even DAX Queries |
| Do they already use other tools to connect to Power BI datasets, today (i.e. Power BI Desktop)? | - Experience with SSBI tooling - Possible data democratization effort/training needed |
| Are they familiar with the data & reports available in Power BI, already? Do they use them? If not, why? | - May be unaware of existing reports or solutions in Power BI that could solve their problem |
| Are they familiar with our data policies? Do they analyze, store & share data responsibly, today? |
- Mitigating governance risk - Adoption & Prevention training effort required |
| Do they combine data with other sources? | - Common use-case - Learn about other data sources relevant to users - Power BI composite models may be an alternative |
DEFINING THE USE-CASES
For what purpose will they use Analyze-in-Excel? What will they do with the data once it’s in Excel? Understanding how & why Analyze-in-Excel will be used is important to fit the right tool to the right problem. This is important to keep in mind — Analyze-in-Excel may be one possible solution, but it also might not be the best solution. Just because the users request Excel data doesn’t necessarily mean that Analyze-in-Excel is the answer.
In general, Analyze-in-Excel is best-suited to the Personal BI Usage Scenario. This may be described by ad-hoc, inconsistent analyses of limited data volumes & complexity by users with existing Excel knowledge. Analyze-in-Excel is not recommended for data export or analyzing high volumes of complex data. Further, repeated analyses may be better-suited for a Power BI report, for example, where the analysis is automated and available from an App or Workspace for others to use. This is not to say that Analyze-in-Excel can’t be used for repeated analyses; if it boils down to preference, it simply depends how end-users might best answer their data questions.
Below a number of Analyze-in-Excel use-cases are listed with general recommendations & alternatives. This is just for illustrative purposes; the governing, golden rule here is “it depends”.
| Example Use-Cases | Recommended for Analyze-in-Excel? [1] |
Example Alternatives in Power BI [2] |
|---|---|---|
| Data export, extraction, snapshotting, etc. for other, downstream purposes |
✗ | |
| Using as an upstream data source for other reports | ✗ | (Composite Model over AAS) |
| Analyzing high volumes/density of data | ✗ | |
| SSBI with high concurrency of use | ✗ | (Import Dataset) |
| Routine analyses that are repeated & anticipated | ✗ | |
| Ad-hoc, one-off or inconsistent analyses (i.e. exploring & validating data; Personal BI) |
✓ | (Reports / Data Mart Queries) |
| Excel-based analyses not easily achievable in Power BI visuals | ✓ | (Analyze-in-Excel only feasible method) |
| Enabling existing Excel super-users in a Power BI SSBI environment | ✓ | (Reports / Data Mart Queries) |
| Combining or mapping to other data sources | ✓ | (Composite Model over AAS) |
| Automating existing Excel reporting | ✓ |
[1]: General recommendations under typical, rational circumstances.
[2]: Assuming the data doesn't necessarily have to be taken from a Power BI dataset.
CRITICAL APPRAISAL
Overall, the key takeaway is to critically appraise the use-case. Is Analyze-in-Excel really the appropriate tool to address this particular business data problem? Scrutinize whether the root business problem has actually been identified, and whether Analyze-in-Excel will truly be a valuable solution.
Discussions about tooling can very quickly become unproductive. Try to steer away from common pitfalls of these discussions; aim to use hammers for nails and screwdrivers for screws. A power drill can technically still slam nails into wood, but it doesn’t mean it’s a smart way to do carpentry.
To illustrate this point, consider the below ‘hypothetical’ anecdotes:
Bink the Data Goblin manages an enterprise dataset about Airship Engines from her Power BI CoE. A regional gnome engineer reaches out to Bink, requesting a daily export of Engine monitoring data. Bink asks what they need, to which they respond with a list of fields and the file in a “.csv” or “.xlsx” format. A lot of time was spent between the CoE and engineers debating how they could get get permission to export the data to Excel.
Considering the request, Bink proposes Analyze-in-Excel, so no exports are required. She thinks this will meet their requirements, while avoiding the effort and risk of setting up an automated export. The engineer is happy. A few days later, however, the engineer returns, upset. They say “the Power BI Excel is too slow” and it’s giving a lot of technical errors.
Investigating deeper, Bink found that the engineer was trying to use Analyze-in-Excel to extract all Engine data at the lowest detail level — 800K - 1,000K rows, which timed out or exceeded the Excel row limit. The initial reaction of some CoE members was to set up the automated export; the discussion with this regional engineering team was tiring and starting to turn into an exhausting conflict. Instead, Bink was curious what the engineer needed all this data for, so she asked them to explain how it was used. Further discussions revealed that the engineer was using the data to detect Engine anomalies in another Excel workbook that was updated daily, and had existed for more than 10 years.
Understanding better how the data was used, Bink worked together with the engineer to help them create a Power BI report analyzing the trendline of Engine data, automating the anomaly detection. It was published to a workspace for that region and refreshed with the CoE dataset it was connected to. The gnome engineers didn’t need to update their workbook anymore, which saved them a lot of time; the “middleman” Excel export wasn’t necessary for a solution.
In this case, Analyze-in-Excel was not the right solution. It was only proposed because the initial conversation focused so heavily on getting the export to Excel, instead of the underlying business question the engineering team was trying to address. The problem was that Bink didn’t know what the data was being used for, and the engineer didn’t know what the best solution might be. The engineer just wanted to do their job, and getting the export was, in their mind, the fastest & easiest way to do that.
Bonk the Business Goblin is an analyst in a finance team focused on regional pricing. This year, material costs have been really volatile, and Bonk has had to do a lot of simulations to help the pricing team plan changes that would preserve the company’s profit margin without hurting market share. Bonk has been getting data from a few old SAP BW systems that are no longer maintained, and combines & analyzes the data in Excel. Once the analysis is done, Bonk e-mails it with additional comments to the other finance & pricing team members, or specific sales people, depending on the situation.
This analysis; specifically, the data retrieval, costs Bonk a lot of time. Worse, the data is often outdated for the latest month, so Bonk’s analyses are often incorrect. Thus, someone in Bonk’s team proposes using Power BI.
Their team use a workspace for collaborating, where they’ve published a dataset with key fields and metrics from their regions. Bonk’s simulations have a lot of ad-hoc updates, so Bonk asks if it’s possible to get the data in Excel. Bonk’s colleague demonstrates Analyze-in-Excel, which Bonk can use to slice & dice the data, referring to specific Analyze-in-Excel pivot tables. Bonk does this from within a Power BI workspace so that the rest of the team can collaborate or provide feedback. Once done, Bonk temporarily shares the workbook from within a Power BI app that the team use for reporting.
In this case, Analyze in Excel was the right solution. Bonk does a lot of ad-hoc analyses without much repeatability; the data needs to be up-to-date and accurate, and Bonk wants to focus on just the analysis & follow-up actions. A Power BI report wouldn’t have helped Bonk, since it couldn’t cater to each of his analyses, and Bonk’s simulations often involved ad hoc formulae and reference pricing reference files that aren’t re-used. Instead, Analyze-in-Excel saved Bonk tremendous amounts of time; Bonk spent no time getting & combining the data and could even distribute the analysis more securely by publishing it to a Power BI Workspace and sharing it from an App. In all, this solution improved efficiency while reducing risk.
Stonk is a Key Account Manager responsible for one of eleven important customer groups. Stonk is quite hands-on and data savvy — liking to dive into the details of the existing Power BI reports provided by the organization’s CoE. One of the most important analyses for Stonk are the rebate reporting. In the customer’s contract, if they order a certain number of magic items per year, they get a 5% cash-back rebate for all their sales that year. The customer has ordered a lot this year, so they ask Stonk for an update on their magic item sales… the catch — the customer wants this shared according to their own product groupings, sharing the mapping file with Stonk.
Unsure how to get the sales data by these customer product groups, Stonk reaches out to the CoE. They explain that Stonk can either make what’s called a “composite model” — which sounds pretty complicated — or connect to the data in an Excel pivot table, performing the VLOOKUP. A former pivot table wizard, Stonk thinks this method will work best. In a few minutes, Stonk connects to the data and makes the right view, doing a cross-workbook VLOOKUP and creating a quick Excel report of the data for a presentation to the customer.
In this case, Analyze in Excel was one of many possible solutions. Stonk could have just as well created the composite model, but preferred to use Excel as that is what they were most comfortable with. Either tool suited the use-case. The only consideration here is that Stonk does not share his Excel workbook with the customer, a risk that could easily be mitigated if the organization was using Sensitivity labels.
To understand who will use the solution, it’s important to start a conversation with users. The approach depends on if you are implementing Analyze-in-Excel reactively to a business request, or proactively as a user enablement tool. In the former scenario, defining the business problem or question very concretely and clearly is important. In the latter scenario, it’s better to do a broader user segmentation exercise; understand the user group as a whole, based on the kinds of business questions they have, in addition to their relative skill level in Excel and Power BI.
HOW DO WE ENABLE USERS WHILE MITIGATING RISK?

TRAINING END-USERS ABOUT ANALYZE-IN-EXCEL

The first step in enablement is education; training users about Analyze-in-Excel is a key adoption & governance action. To start, clearing up assumptions and exemplifying use-cases can be done in short demonstrations. Thereafter, one of the biggest challenges is effective data democratization; helping users find the data they need among the Power BI datasets they have access to by leveraging endorsement & effective workspace planning & access management. Even within a single data model, it can be difficult for users to find what they need. A big part of making this easier is following some consistent data hygiene & adding descriptions, but most data models will still require some training for users to use them properly. But how we best train users to use Analyze-in-Excel?
Part of doing this involves building toward a mentality shift. Many users approach Excel-based analysis by starting with “getting all the data”. This may lead to performance issues and timeouts, particularly since Analyze-in-Excel sends MDX instead of DAX queries to the dataset. Instead of starting with fetching “all the data”, users should be instructed to first filter and aggregate to the detail they need for their analysis.
Below are examples of training topics to consider for Analyze-in-Excel end-users:
| Training Topic | |
|---|---|
| Set-up: Installing the necessary dependencies, logging into Excel, etc. | - Some users may need to install the 'Analyze-in-Excel' updates |
| Connect to a Power BI dataset | - How to bring data into Power BI for their analysis - How to find 'the right' data in Power BI |
| Pivot Table UI & How to use a Pivot Table | - Navigating a Power BI Dataset - Adding fields & filters - Adding slicers |
| How to sort a Pivot Table | - Not so intuitive; Row Labels > More Sort Options... |
| Set filters & detail level first before the analysis (only request what you need) | - Improving performance and reducing query load |
| Interpreting & troubleshooting common errors | - Helping users troubleshoot timeouts or expensive queries |
| Switching data sources (i.e. switching to a different Power BI dataset) | - Changing between i.e. dataset versions or types (QA, PROD; regions) |
| (Conditionally) Formatting Analyze-in-Excel Pivot Tables and Slicers | - Styling the table & visualizing the analysis |
| Publishing Analyze-in-Excel files to a Power BI Workspace | - Securely sharing the analysis via Power BI |
| Responsible use & distribution of the Analyze-in-Excel file | - Clarifying relevant data policies & user accountability |
| When to use Power BI vs. Analyze-in-Excel for an analysis | - Performance issues in Excel - Visualization options in Power BI - Automating in Power BI - Integrating with Power Automate & other tools |
DISTRIBUTION & ANALYZE-IN-EXCEL: CENTRALIZED OR DECENTRALIZED?
How are users expected to start their Analyze-in-Excel analysis? Do they begin from an empty file, adapt a common template, or simply use an existing pivot table from a central location? This is an important consideration when integrating Analyze-in-Excel in our existing governance model. To know the options, consider the following:
Analyze-in-Excel is possible both from Excel on desktop as well as Excel online. This means that it’s possible to use and refresh an Excel pivot table from a…
OneDrive or SharePoint document library
Power BI Workspace
Power BI App
It’s thus possible to distribute an Analyze-in-Excel “report” through a Power BI App in the same way as a Power BI report, meaning that users can still benefit from the flexibility and user experience of a live-connected Excel Pivot Table without everyone using their own file. Multiple pivot tables can be published in pre-made templates to kick-start user analyses so they don’t waste time making or formatting the table.
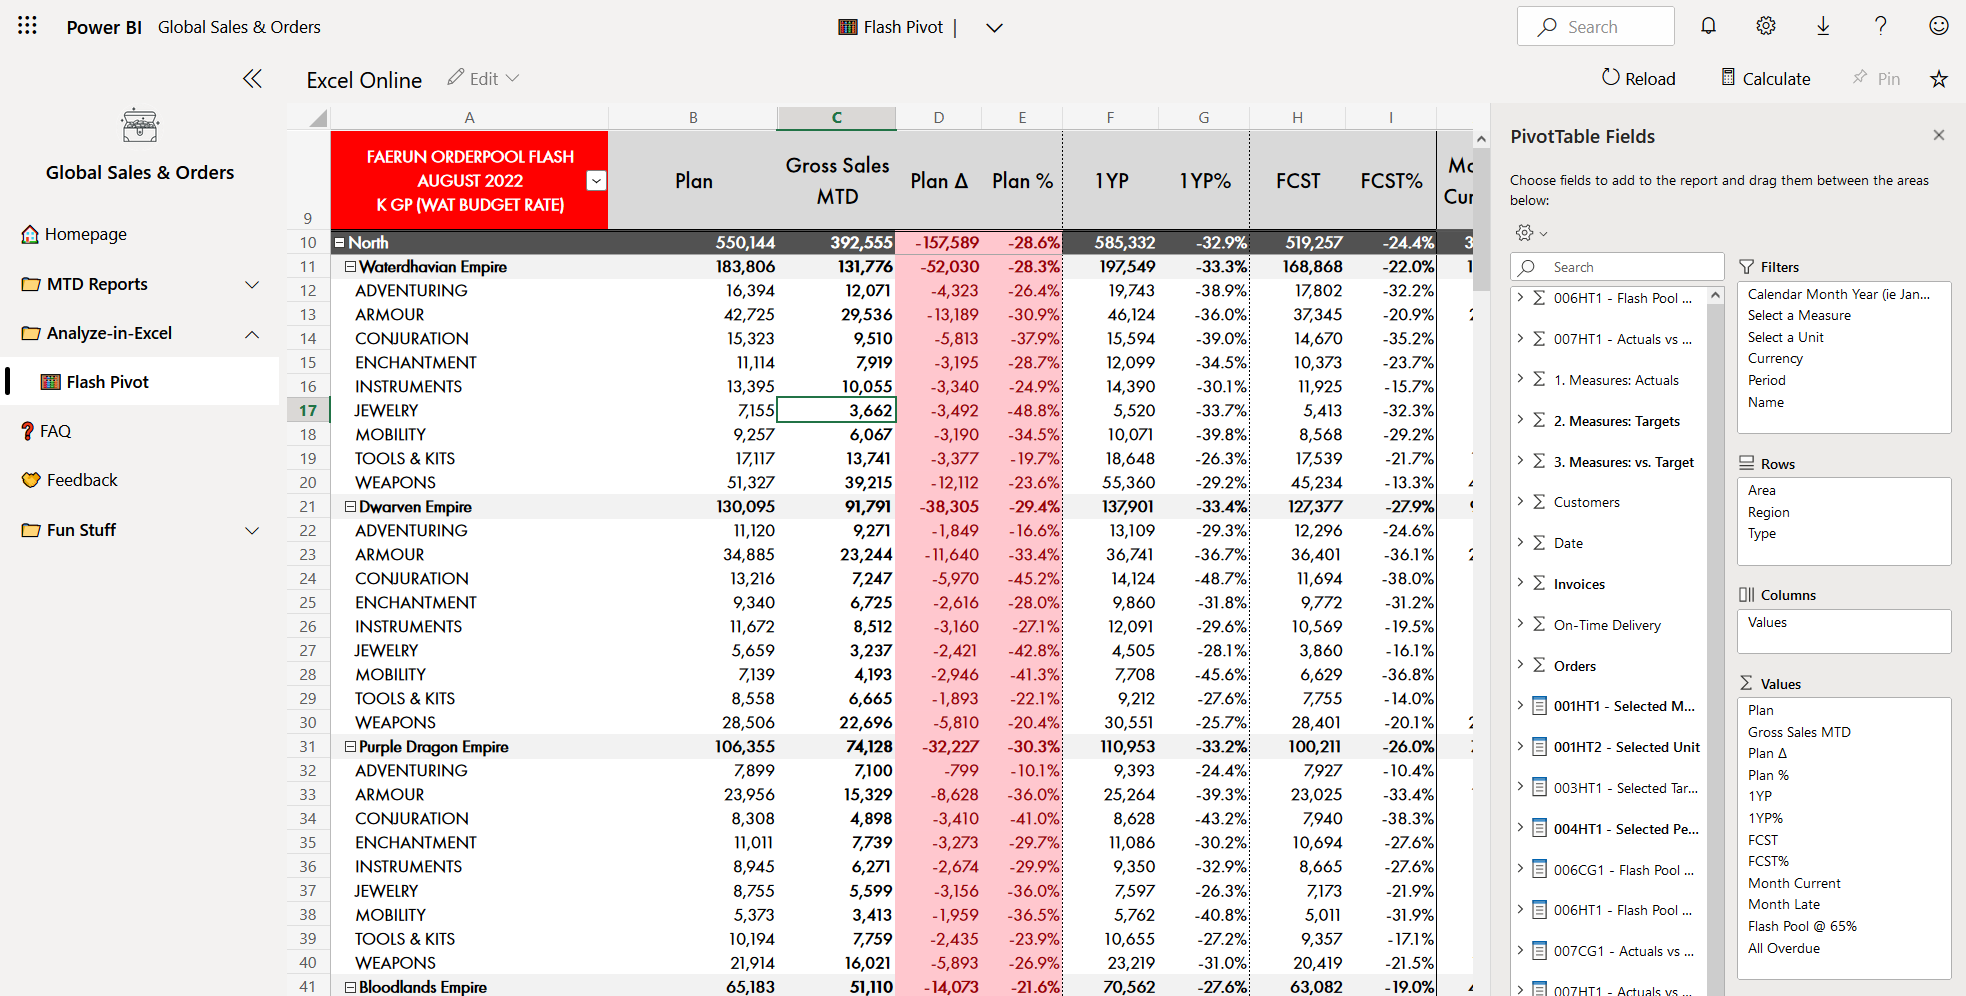
An Analyze-in-Excel file in a Power BI app. Notice that the “edit” button is disabled.
So do we wish for a more decentralized approach — where everyone has their own Excel file — or a centralized approach from within an App or Workspace? Like with any Power BI solution, this depends on the goals and usage scenarios.
DATA LOSS PREVENTION & SENSITIVITY LABELS - MITIGATING RISK
In a decentralized approach where everyone has there own Excel file, there might be a risk of data loss should someone share the workbook via mail or other channels. The recipient cannot - without build permissions - send queries to the dataset and see additional data, but they will see the pivot table in its previously saved state. For example, if a sales person accidentally sends the Analyze-in-Excel file to a customer, the customer will not be able to see sales data from our other customers.
Depending on the data and policies within our organization, we may seek more strict data loss prevention policies. Doing this is possible with Microsoft Purview. Using features like sensitivity labels, we can enforce policies that restrict unauthorized persons from opening or distributing files, for example. This applies across all O365 content, from Word and PowerPoint to Excel and Power BI files. What makes this so effective is sensitivity label inheritance. Content that is created from a labelled dataset will inherit the label of that dataset, meaning it will have the same label. This also will apply to Analyze-in-Excel content, meaning that we can ensure no one mistakenly distributes company information outside of our organization, and no unauthorized actors can open those files.
An important, current limitation is that inheritance applies to a maximum of 80 items, whereafter no inheritance is applied. If a widely distributed dataset is used in a self-service environment, this might be an important figure to monitor or be aware of, as it’s quite low. A more conservative policy could apply that enforces mandatory labelling across all Excel and Power BI files, where every policy restricts unauthorized distribution & viewing.
MONITORING ANALYZE-IN-EXCEL USE
A useful solution would be a report that provides an overview on the most active users for each tool connected to the dataset, including Analyze-in-Excel, and the queries sent. Despite the potential value of such a solution, unfortunately, this is very difficult to achieve. The best that is possible is to monitor the overall frequency with which a given dataset is analyzed by an external application - Power BI or Excel.
Unfortunately, there is presently (Nov 2022) no out-of-the-box monitoring solution for Analyze-in-Excel provided by Microsoft. For Power BI reports, the usage metrics report gives an overview of how frequently the report is viewed, and which pages are most popular. Connecting to a dataset from Analyze-in-Excel or Power BI can only be monitored using the Activity Log, accessible through a REST API.
Thanks to a recent discussion with Jordan Kline & Štěpán Rešl, I’ve recently learned that this is further complicated as Analyze-in-Excel activity is not clearly visible from the log. The activity ‘AnalyzeInExcel’ purportedly does not correspond to users doing things in Analyze-in-Excel, rather it logs when a user selects the “Analyze-in-Excel” button in the Power BI service, providing limited useful information. Users connecting & sending queries to the dataset falls under the ‘AnalyzedByExternalApplication’ activity. It thus seems to not be possible to separate user activity between applications.
HOW CAN WE IMPROVE ADOPTION?
ANALYZE-IN-EXCEL TEMPLATES & THEMES
Common with Power BI .pbit files, templates give a quick-start for users to begin their analysis while nudging them toward general best practices. For Analyze-in-Excel, it is also possible to provide “starter” .xlsx files available from a Community of Practice portal, for example, or visible from within a Workspace or App. These templates can go a long way to not only helping adoption of Analyze-in-Excel, but also reducing unnecessary queries and improving best practices.
Below are some examples of valuable considerations for an Analyze-in-Excel template:
While saving a few clicks and seconds, this can be convenient for some users that struggle with navigating the ribbon interface in Excel to connect to Power BI. For some, it’s easier to just save a link to where they can find “the file”.
An extremely low-effort task that can have a lot of benefit, branding Analyze-in-Excel templates can go a long way in making them look more professional and consistent. Further, XML themes used for other O365 branding can be re-used in these files, or easily created from within Excel.
Under Pivot Table Analyze… > Change Connection Source… > Connection Properties… there are a number of settings that can be configured to reduce or increase the refresh frequency of the connection. For example, the file can refresh upon opening, or every N minutes. For smaller queries this is fine, but this becomes problematic if there are multiple sheets with larger queries being sent.
Optimizing connection properties
Pivot tables can easily be formatted by enabling ‘Select Pivot Table’ Similar to branding, conditional formatting can go a long way in making the Analyze-in-Excel file look more professional. Further, it also adds some data visualization to the Pivot Table, improving the overall efficiency of the analysis by reducing cognitive load; it will be easier to identify stand-out datapoints.
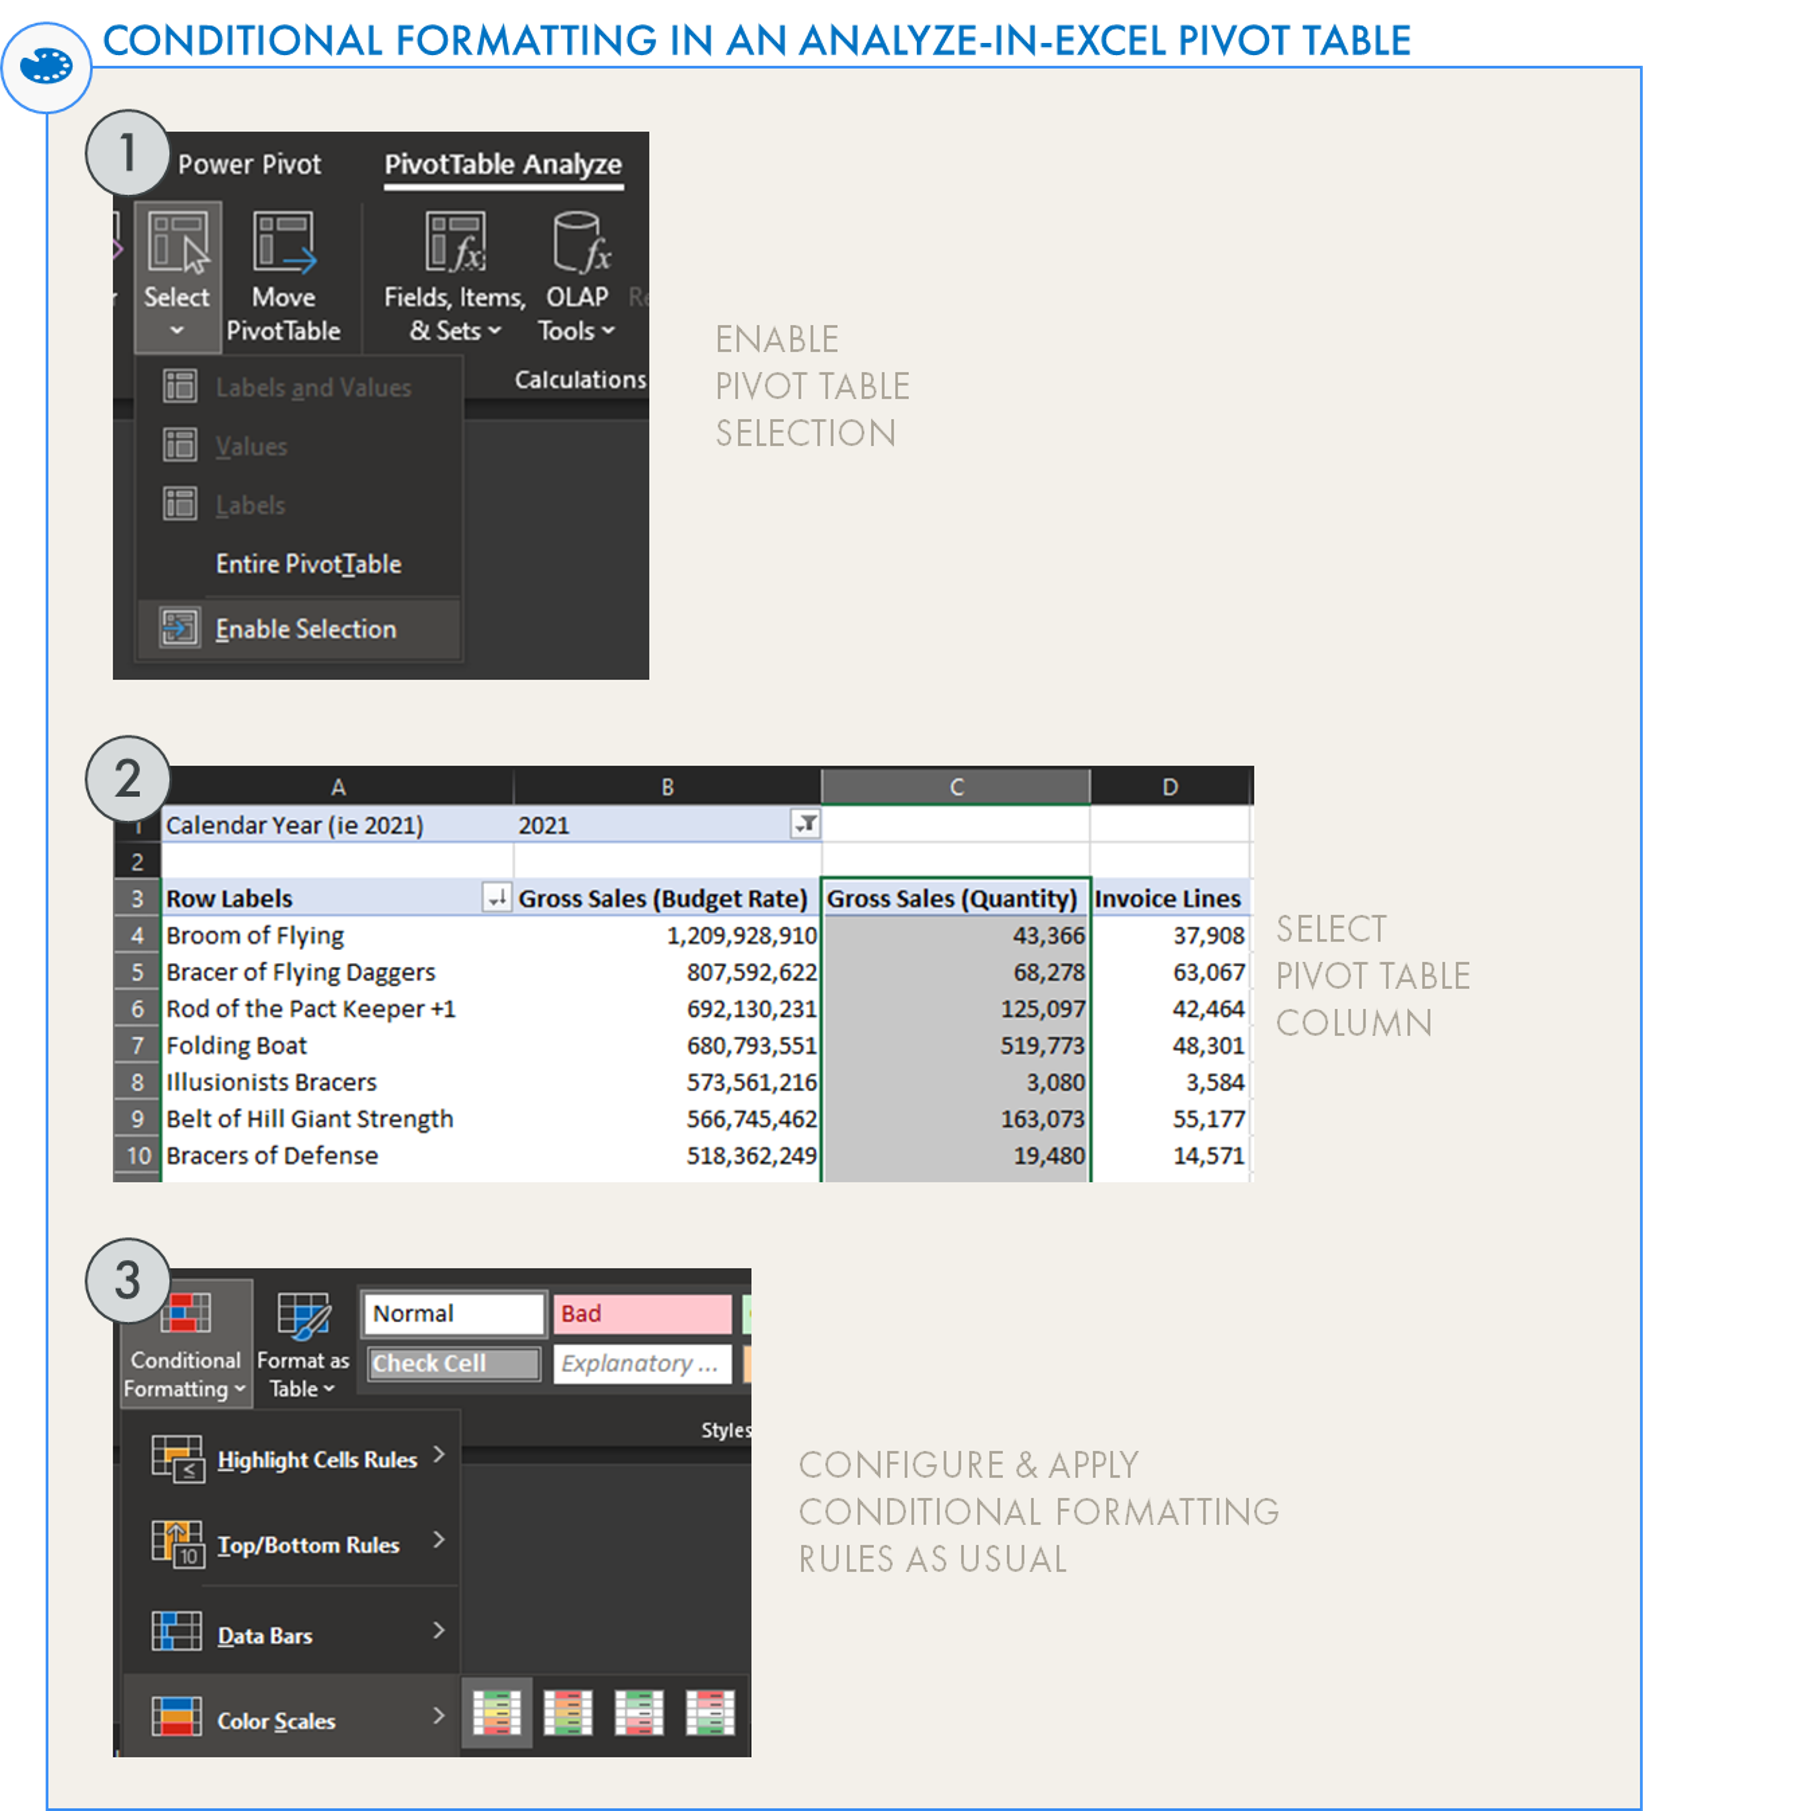
How to apply conditional formatting to a (Analyze-in-Excel) Pivot Table
In an Analyze-in-Excel analysis, users will waste the most time looking through the model to find what they need. The best way to reduce this is with training, model hygiene & descriptions, but pre-made templates can also speed this along. Making these available from the Community of Practice portal or another central repository can save a lot of time. Further, users can be encouraged to place their own analyses here as re-usable templates for others in the future.

TO CONCLUDE
Analyze-in-Excel is a powerful feature in the Power BI ecosystem that is also deceptively simple. If neglected, Analyze-in-Excel can quickly spiral into a data governance risk and a data literacy roadblock in your organization. However, if used and managed in the right way, Analyze-in-Excel is an opportunity to empower Excel super-users and automate Excel-based use-cases, helping people get answers quicker so they can focus on other tasks that bring value.
DATA GOBLINS POWER BI ANALYZE‑IN‑EXCEL CHECKLIST
Version 1.0 - Last update: Nov 14, 2022
Use the below interactive checklist to follow-up on your Analyze-in-Excel solution:
Click the question mark (?) for a link to a reference document. This will be learn.microsoft.com documentation; if none are available, this may be a Data Goblins article, or another blog post reference.

