Dimensions of Self-Service in Power BI: Part 1
PART 1: SELF-SERVICE TIERS & LEVELS
The options available for self-service reporting in Power BI, their considerations & use-cases.

IN THIS SERIES

Export to Excel is more likely to make a mess than enable users in any sustainable self-service way
With Power BI self-service, there are a lot of options. Which of these are right for us? It is difficult to decide a self-service model that works for our organizations. There are no one-size-fits-all solutions; we can't unleash "Analyze-in-Excel" all willy-nilly, nor can we necessarily expect all of our users to be able to create their own Power BI datasets. At the same time, we shouldn't lock out self-service altogether. We should consider the different tools and approaches - it’s important to reflect on which users will get access to what, how they will use it and why. If we neglect this, users may not have the right tools to answer the right questions. To make this easier, it helps to think about this challenge by examining each "level" and the dimensions underneath.
In this article, I visualize these levels of self-service options available in Power BI.
When depicting the self-service toolset in this way, it can be easier to reflect on your self-service strategy - how certain tools & users will be supported to answer business problems, and how they will be managed.
Note this post is focused on methods & tools; adoption is a separate, important point to consider.
SELF-SERVICE TOOLING IN POWER BI: DIMENSION 1
There are many different base tools & approaches used to address business problems with data in Power BI. They are positioned along an axis that rises in flexibility the tools provide, as well as the data skills users need to be effective with them, and the effort to create & maintain the solutions.
Tiers of self-service in Power BI
It can be helpful to think about each option as “levels” grouped in “tiers”, rising in complextiy from (1) Use of Published Reports to (8) Creation & Distribution of Dataflows & Datamarts. Each of these levels are made of different primary tools with their own considerations, use-cases and governance / implementation needs:
Levels of Self-Service tooling in Power BI
TIER A: USE OR MODIFY REPORTS

These are limited end-user experiences where no additional tools are required. Users leverage the functionality & design in published reports to interrogate the data at their own pace. They are limited by the report & data model design, but do not need to learn new software or tools to answer their questions. There is little risk of users creating irresponsible queries since they cannot create new reporting items; they only use what is already there. Maintenance is thus easier, since its centralized in the reports they are using.
Personalize visuals is particularly valuable, though in my experience, scarcely used in practice. With good model perspectives and some flexible views, users can have a full pseudo-report creation experience without ever creating new reports or using Power BI desktop.
-
What it is: Default data consumption experience; using basic interactions in central reports.
When to use it: Enterprise reporting scenarios, or early in Power BI implementation. Also worthwhile when facing significant challenges with up-skilling user communities. This can be used to deliver advanced reporting experiences (i.e. custom visuals) that self-service users might not be able to create.
Tools or Licenses Required: None; Power BI Pro (& PPU) if consuming reports from a Pro (& PPU) workspace.
Data Skills Required: Business user report consumption; knowledge of the Power BI app UI & how to use the various interactions.
Governance: No special governance considerations are required. Business end-user training sessions should be organized, and usage metrics should be monitored to ensure central reports are used.
Limitations: The user cannot change the graphs or data, and cannot add their own information.
-
What it is: Leveraging flexible reporting visuals or designs, for example the Decomposition Tree visuals or Detail-on-Demand matrixes with Field Parameters.
When to use it: When Enterprise reports need more flexibility, or users want to explore data within existing Power BI report visuals without changing them.
Tools or Licenses Required: None; Power BI Pro (& PPU) if consuming reports from a Pro (& PPU) workspace.
Data Skills Required: Advanced knowledge of Power BI report interactions, such as how to perform cross-filtering across multiple visuals, combined with drill-downs and drill-throughs.
Governance: No special governance considerations are required. Business end-user training sessions should be organized, and usage metrics should be monitored to ensure central reports are used.
Limitations: The user cannot change the graphs and can only change the fields as it has been designed. No new data or reports can be created.
-
What it is: Using the ‘personalize visuals’ feature of service reports. Users can swap fields in report visuals or change visual types and formatting without creating new reports or affecting the reporting experience for others. Perspectives, created in Tabular Editor, can limit the available fields for users by reporting page.
When to use it: When users want a high amount of flexibility in available reports, or the ability to change or modify chart types. This is also good when a report serves a large group with subtly divergent needs. This can be extremely powerful if used correctly, allowing users to get a near-complete reporting experience without creating new artefacts.
Tools or Licenses Required: None; Power BI Pro (& PPU) if consuming reports from a Pro (& PPU) workspace.
Data Skills Required: Users need knowledge about the Personalize Visuals feature as well as Power BI visuals and how they can be changed. They need to be trained to use perspectives to them, so they know which fields are available and how they should use them.
Governance: Perspectives need to be maintained and updated. Perspectives should be carefully made to limit available fields to only what the users need; it is better to provide a limited subset and slowly expand it. There should be a way for users to request changes to the perspectives or to provide feedback on the model, i.e. renaming fields, tables and measures.
Limitations: The user cannot change the graphs or data, and cannot add their own information.
Click the below animations to expand and see a demonstration
Creating experiences around exploratory visuals like the Decomposition Tree.
Personalize visuals gives users control of visuals for themselves, letting them change fields & charts
TIER B: CREATE OR ENRICH REPORTS

Here users of Excel or Power BI Desktop connect to Power BI datasets, preserving data security & a single source of truth while enabling users to explore data & create their own reports. They leverage enterprise datasets created either by IT, the Center of Excellence or Champions within the end-user community that have more knowledge about data modelling & DAX. This frees up central teams to focus on enterprise reporting usage scenarios rather than dedicating capacity to ad hoc report requests, and democratizes the data in the hands of the business.
Note that the Composite Models over Power BI Datsets & AAS is a preview feature still in development. For more information, see this link.

For Tier B-D solutions to be successful, effective governance & adoption methods are required:
CULTIVATE A COMMUNITY OF PRACTICE
To successfully implement managed self-service, BI teams need to cultivate a data culture of knowledge-sharing among both users & developers. This Community of Practice is an essential concept introduced in the Power BI Adoption Roadmap authored by Melissa Coates & Matthew Roche et al. Doing this means socially engineering a shared space & culture that incentivizes learning, compliance and data literacy, the goal of which is to produce an independent and enabled user community.
USE DATASET & REPORT ENDORSEMENT
It’s important to leverage the endorsement features in Power BI service to clearly certify what these single-truth datasets are, so they can be labelled as ready-for-use. There should also be policies in place to promote quality reports while demoting promoted reports that don’t fit the bill.
USE SENSITIVITY LABELS & DATA LOSS MANAGEMENT POLICIES - MICROSOFT PURVIEW
Self-service users can analyze the data themselves, creating & distributing their own reports. As such, it’s recommended at this level to use Data Loss Management policies & Sensitivity Labels. Having Mandatory and Inherited Sensitivity Labels will mitigate risk of Data Loss due to unsanctioned distribution of data or report exports.
CATALOG THE DATASET & TRAIN USERS TO USE IT
Datasets created for consumption need to be made in a business-friendly way. Fields should be evidently named and sorted into folders, while technical fields should be hidden. Ideally, there should also exist a catalog of what is in the dataset and how it is made. Data cataloguing & lineage tools like Purview certainly help, here. Despite any organization & cataloging efforts, though, users will still need training in order to know which measures & fields to use.
CREATE A POWER BI ADMIN MONITORING SOLUTION
Administrating this ecosystem requires a monitoring solution to survey both user activities and the number & quality of assets being published & shared. Creating such a solution means relying both on out-of-the-box admin solutions like the Premium Metrics app and Admin Portal Usage Metrics (which is rather limited, and that tree map is brutal), as well as creating custom solutions with the Power BI REST APIs & Activity Logs.
-
What it is: Connecting to Power BI datasets from Excel, exploring the data from Pivot Tables.
When to use it: When there is an explicit requirement for Excel-based reporting, and users are knowledgeable with Excel Pivot Tables. If users are struggling with learning Power BI desktop but have skills working with Excel, this can be a helpful alternative.
Tools or Licenses Required: None; Power BI Pro (& PPU) if consuming reports from a Pro (& PPU) workspace.
Data Skills Required: The user requires an understanding of the Power BI data model to use it effectively. They also should have a good understanding of Excel pivot tables and how to connect to existing datasets. They should understand that their actions in the Pivot Table generate queries and understand the limitations and risks of working with the data in this way. They should also have an understanding of the organization’s reporting & governance objectives, to not create additional reports in Analyze-in-Excel which overlap with automated Enterprise reporting that already exists.
Advanced users might know how to use Detail Rows expressions, or even be able to modify the DAX queries generated by these actions to query the data themselves in DAX.
Governance: It is recommended that pre-built ‘starter kit’ templates are provided to users. Ideally, Excel files should be published to the Power BI Service or used from a central drive, with downloading disabled. If users are allowed to have their own local .xlsx file for working, Sensitivity Labels and Data Loss Prevention Policies should be used to prevent risk of data loss. When data is in the Excel pivot tables, they can be copied out of the files to other worksheets. To ensure successful user compliance and enablement, it’s recommended that users have an explicit agreement to create accountability.
Limitations: Analyze-in-Excel generates MDX queries to the Power BI dataset. It is thus not as performant as Power BI solutions, which generate DAX queries. Analyze-in-Excel should not be used for very high volumes of data.
Further, Analyze-in-Excel should be avoided where an automated reporting solution would better suit. If there are many users doing the same analysis (i.e. Year-over-Year growth by Country), it makes more sense to turn this into a Power BI report than have dozens of users making variations of the same pivot table.
-
What it is: Connecting to Power BI datasets to create reports either in the service or Power BI Desktop. These reports can be published to the Service and shared with other users.
When to use it: This is most often seen in managed self-service usage scenarios. A central team with data modelling / engineering skills creates the datasets, while business users connect to them to create reports. Using the Drag & Drop user experience of Power BI, end-users create charts and visualizations that update with the data, letting them focus on the analysis instead of data prep.
Tools or Licenses Required: Power BI Pro. If consuming a dataset in a Premium-Per User (PPU) workspace, a PPU license is also required.
Data Skills Required: Knowledge about the data model is required, as well as how to use the Power BI user-interface. Report creators should have good visual literacy skills to be able to create charts and visualizations instead of relying on tables & matrixes.
Governance: It’s important to be able to monitor what is being created and how it’s being shared in the organization. A monitoring solution looking at usage patterns and the number of assets in an environment is essential. Special attention should be paid to any reports created for the purpose of exporting data to excel or .csv.
Data loss prevention with sensitivity labels is recommended, using default & inherited sensitivity labels to ensure that Power BI Desktop reports are labelled appropriately in accordance with the data they are connected to. Stricter policies can enforce mandatory labelling, to ensure that no .pbix files are created without labels and helping ensure sensitive information will not be shared outside the organization.
Limitations: The user cannot add their own data. It is possible to add their own calculations using DAX, but this is very difficult for the average user, and creates additional governance challenges.
-
What it is: Enriching a central dataset with additional data sources, calculations or logic. This allows preservation of central truths while still enabling users to add their own data or flexibility to meet specific individual or team reporting needs.
When to use it: This is most valuable when users have additional data that they want to incorporate which doesn’t cover the entire dataset scope. For example, if there is a department or team-specific grouping of products/customers, or a more detailed or updated forecast they want to use.
Tools or Licenses Required: Power BI Pro. If consuming a dataset in a Premium-Per User (PPU) workspace, a PPU license is also required.
Data Skills Required: Users need to have a basic understanding of Power Query to extract, transform and load new data into the dataset. They also need an advanced understanding of the central data model to be able to create limited relationships to existing tables.
Special trainings are recommended to make sure that users understand how to use and get value from composite models, and have a good grip on use-cases and limitations.
Governance: It’s essential that the users creating composite models are particularly monitored. There should be careful attention paid to what data and logic are being added, and how composite models are being used. Governance methods to avoid duplicate & redundant composite models should be in place, and good trainings have to educate users on how to best use composite models.
It is a significant set up in skill requirements from creating reports to creating composite models. Even for Power BI Developers, composite models have unique considerations that require care & thought when engineering a solution.
Limitations: Since the user will be creating a Direct Query connection to the central Power BI dataset, limitations of Direct Query apply. See https://docs.microsoft.com/en-us/power-bi/connect-data/desktop-directquery-about.
It should be noted as well that this is still a preview feature that has been undergoing extensive development & changes since first released in January 2021. See: https://docs.microsoft.com/en-us/power-bi/connect-data/desktop-directquery-datasets-azure-analysis-services
Click the below animations to expand and see a demonstration
Analyze-in-Excel allows users to connect to Power BI datasets from pivot tables
From Power BI Desktop, users connect to datasets & create reports with a drag & drop experience
TIER C: CREATE DATASETS

This level is complex, as it involves users loading data into Power BI and creating their own data model, measures and logic, then sharing & reporting from these datasets. Such datasets can be small - from a single Excel file - or connect to analytics layers & flat files simultaneously to combine large amounts of data. Maintenance here is thus very high, as it involves a lot of effort to train users and manage the environment where they are distributing. Users have diverse levels of knowledge of Power BI depending on their needs. It is thus difficult to manage this scenario since a one-size-fits-all approach will not work.
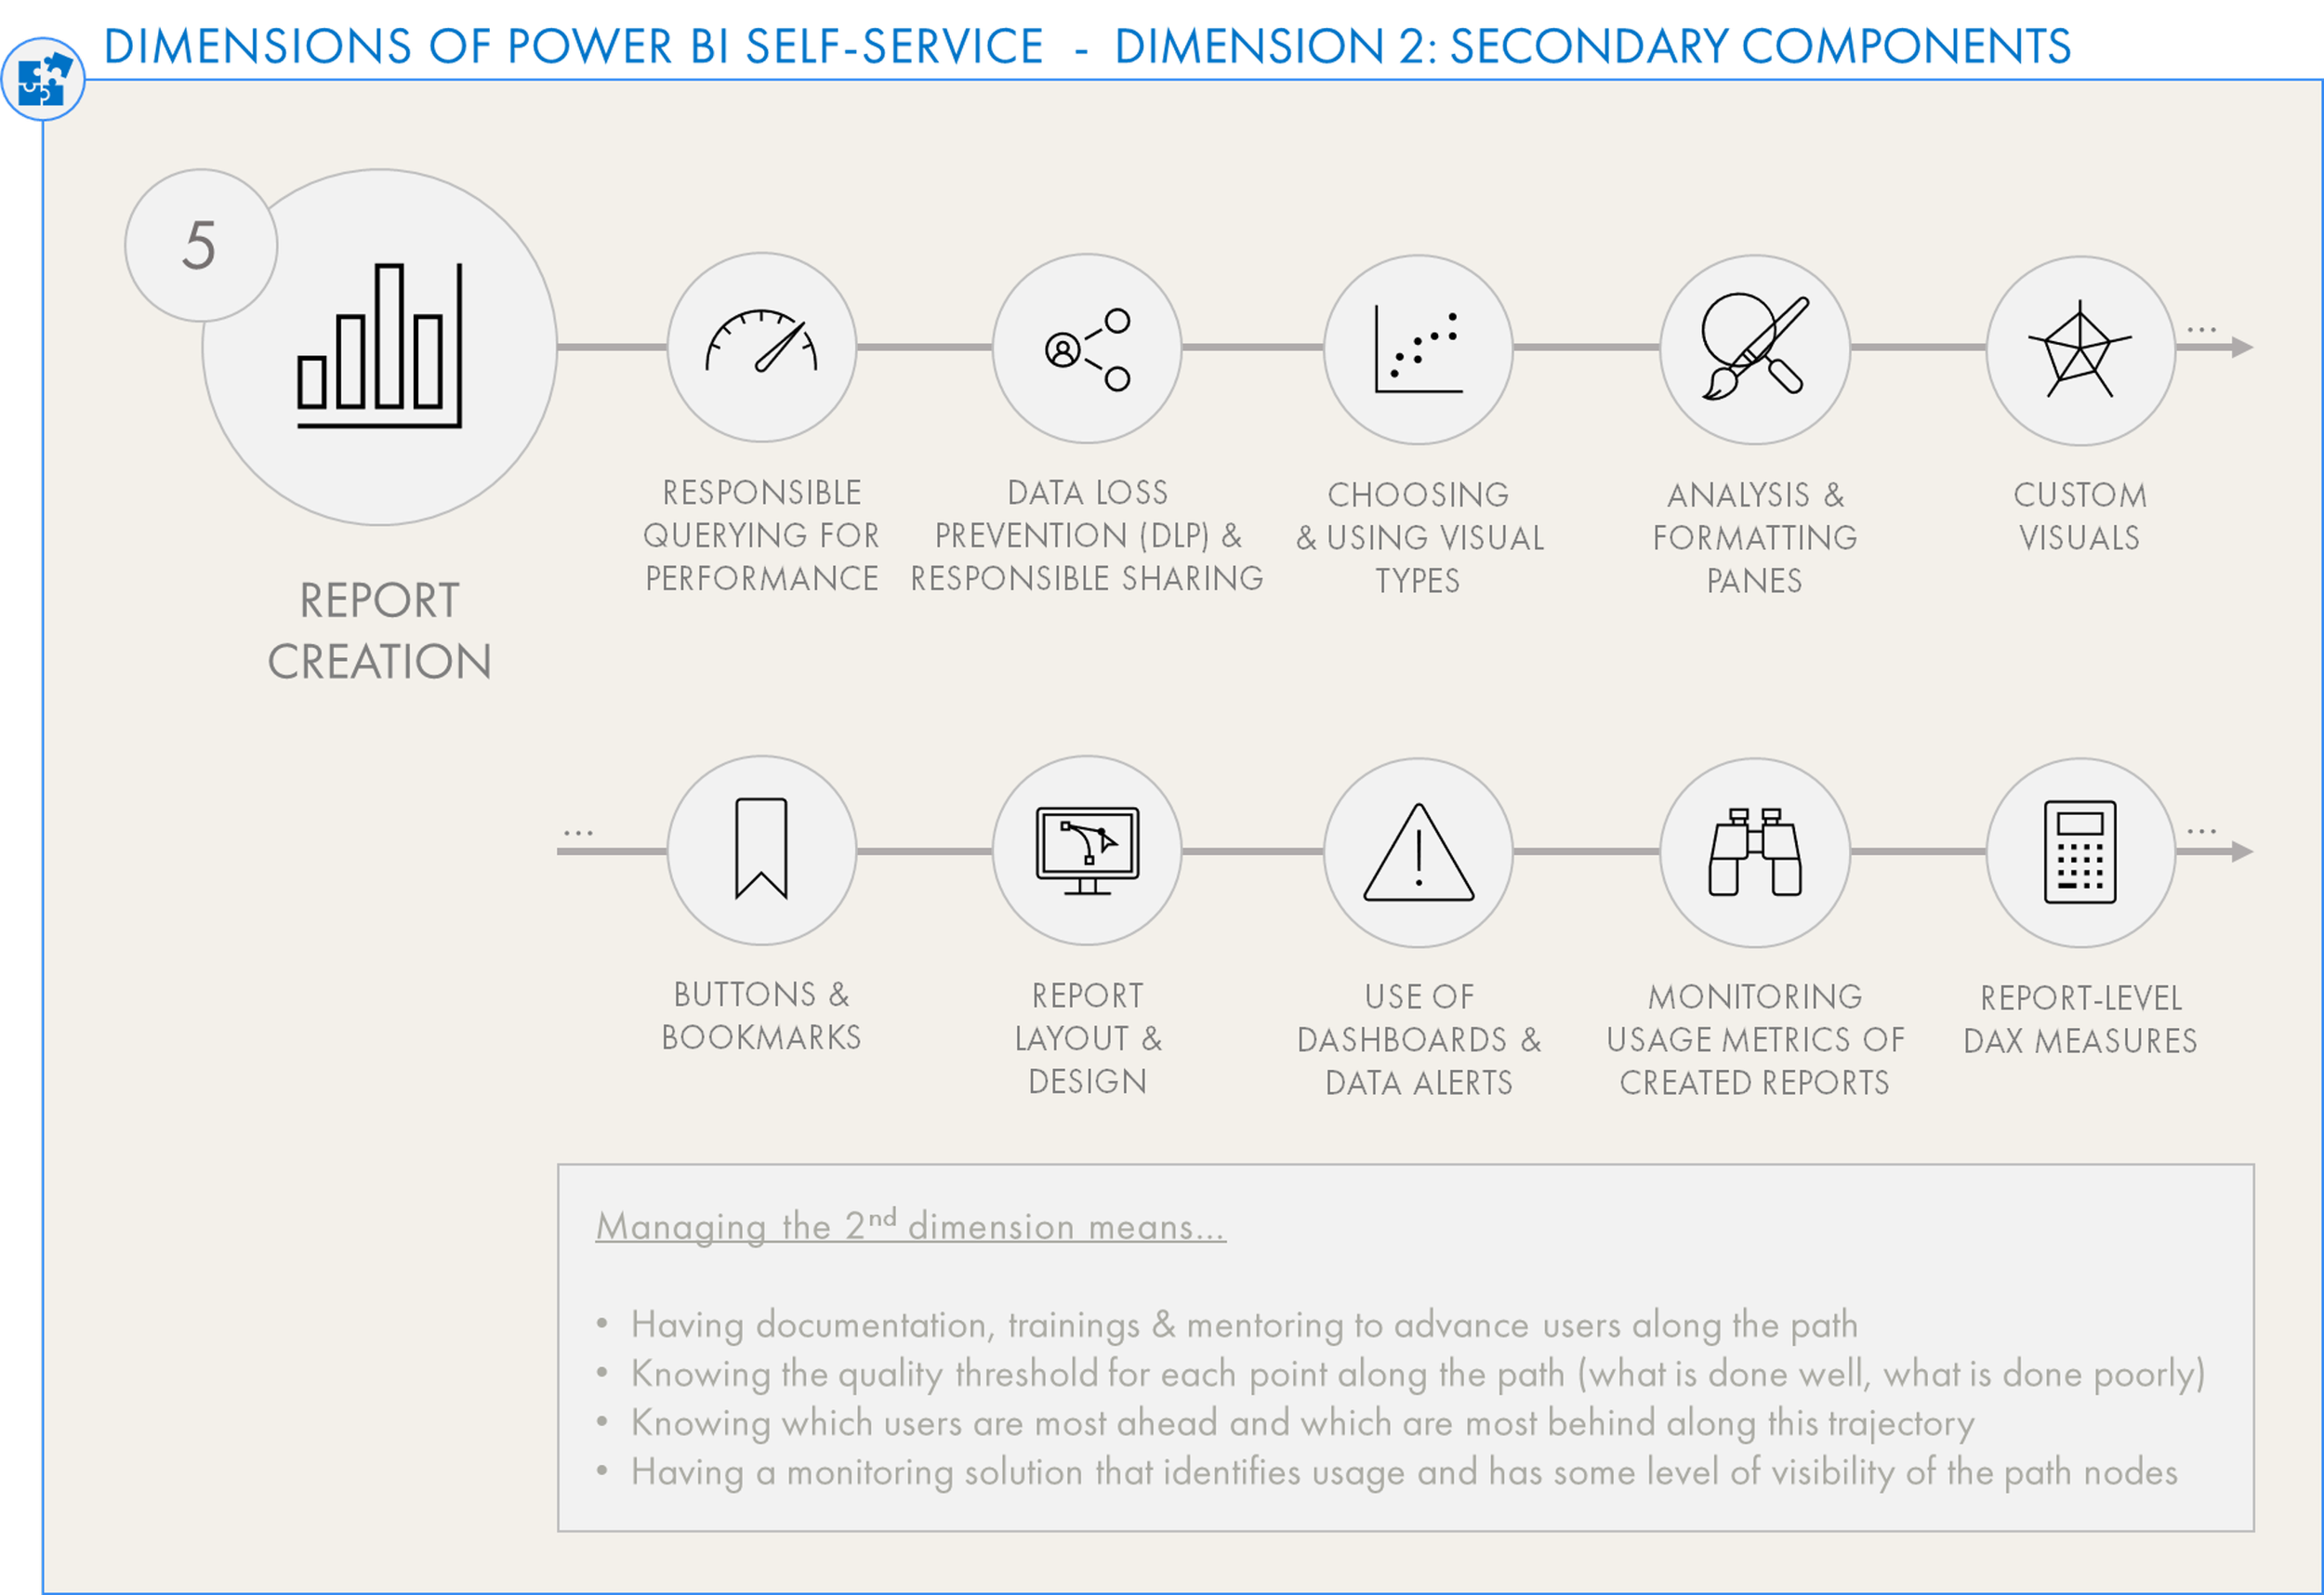
Each user (group) will follow their own learning trajectory based on their needs and skill. Being aware of this is important to govern & monitor this situation. Mapping this out is difficult, however, and might be covered in a subsequent post looking at the other dimensions beneath the tools themselves:
-
What it is: Creation of Power BI data models and reports, usually using Power BI Desktop, but sometimes also in the Power BI Service. Users connect to data and transform it with Power Query, then sometimes creating a data model and using DAX calculations before publishing it for others to use, or for serving their own reporting needs.
When to use it: This is the full self-service experience where users create both datasets and reports. Usually this is done in combination with enterprise solutions that serve a broader audience, while specific business units or departments create their own datasets. This might be seen where there is a small or no formal BI team, or where the BI team is more focused on governance and data democratization over creation of traditional data solutions.
Tools or Licenses Required: Publishing and sharing datasets and reports requires Power BI Pro, and also a Power BI PPU license if the users should publish to a PPU workspace.
Data Skills Required: This varies depending on the needs of the user. Generally, the user should have good data literacy skills and understanding of the various aspects of Power BI. When datasets become more complex and heavily used, users need to understand more advanced concepts like data modelling, optimization, etc.
Ideally, users should also understand the principals and value of good data governance.
Governance: User-created datasets need to be monitored from a distance. Admins and a Center of Excellence team should have a view on the number of datasets created and what their contents consist of. There should be ways for experts to easily audit the datasets using metadata, for example using tools like Tabular Editor 3, DAX Studio & VertiPaq Analyzer.
Like with Tier B, a community of practice is essential, here.
Limitations: Limitations encountered at this level will likely be due to the skill ceiling of the respective user. For example, users relying on implicit measures will eventually encounter challenges with aggregating different kinds of data, requiring that they use & learn DAX.
As mentioned above, it’s essential to have a map of each user group according to their needs and skills in Power BI. This will enable creation of effective mentoring and enablement programs to give them the skills they need to make good datasets that are still compliant with policies & standards.
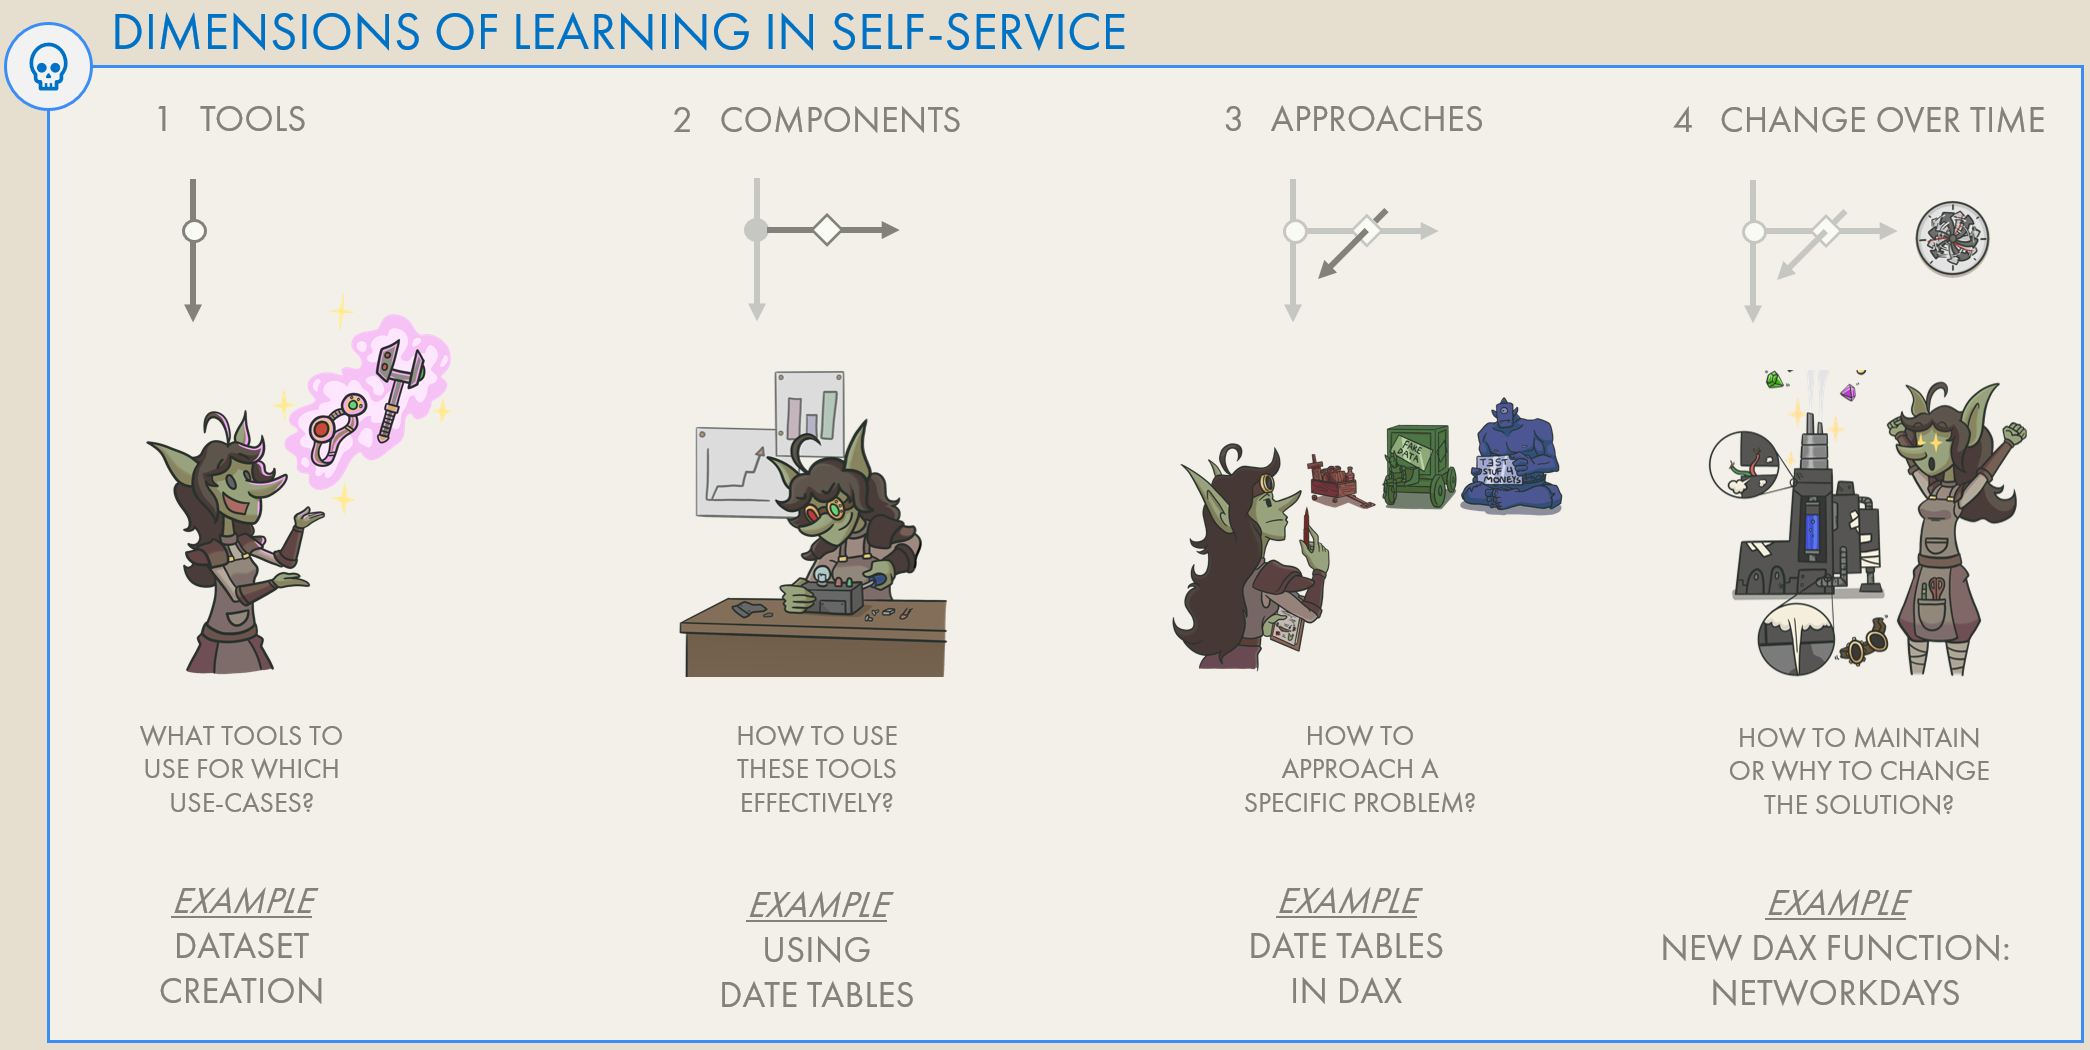
Dimensions of Self-Service: Learning Trajectories
Mapping users along a learning trajectory vs. their needs is important for adoption & governance, and generally ensuring that users are enabled to successfully use Power BI to answer business data questions.
TIER D: CREATE DATAMARTS (OR DATAFLOWS)

The last level is the most complex since it’s one layer earlier; it’s the centralized creation of ETL solutions for data to be used by multiple datasets. These are the highest effort to manage & maintain, but afford the highest flexibility & agility if used correctly by the right users for the right use-case. These cases are generally used to support larger-scale self-service implementations, either in the usage or the volumes/complexity of data.
Note that Datamarts are a Premium feature that is currently in preview. For more information, see this article.
Using Datamarts or Dataflows in self-service requires users to think of solution architecture — considering multiple layers rather than doing everything inside a single .pbix (dataset + report).
It is possible for users to create datamarts or dataflows to feed single datasets, though more commonly these are re-used among multiple datasets to preserve a central transformation logic. This tier has generally the same considerations as Tier C, although since it forces users to work in a “multiple layer” usage scenario they have to think in a broader platform/solution way. This is opposed to Power BI Datasets, where a user with a simple scenario might just connect to an Excel file and create a report in the same file, being naïve to the concept of different data layers.
-
What it is: Using the “Power Query Online” web authoring experience to create ETL solutions. Data is transformed and stored in a managed Azure Data Lake (Dataflows) or SQL database (Datamarts) handled entirely in the Power BI service. Low-code user interfaces simplify getting & preparing data for use by others in datasets and downstream reports.
When to use it: When there are data transformations that need to be centralized outside of a traditional, IT-managed analytics layer (i.e. Azure Synapse). For example, if multiple users want to use a forecast in their dataset, rather than both users transforming the data in their dataset - possibly in different ways - it can be done upstream in a Datamart or Dataflow. The users can then connect to it and use the data; it only needs to be transformed once. The transformed data is stored in the service and the flow can be scheduled to run automatically on a daily or weekly basis.
Tools or Licenses Required: Power BI PPU or Premium. Dataflows can be created with a Pro license, but Power BI Premium or PPU is required to use the Datamarts premium feature.
Data Skills Required: Business users need sufficient understanding of Power Query and data transformation methods to be able to effectively use Dataflows or Datamarts. In Datamarts, Business Users should also have a basic understanding of SQL to be able to leverage T-SQL endpoints; however, it is also possible to query data in a visual way.
Governance: Monitoring solutions are essential, particularly in premium environments. Data lineage tools like Purview are also important to be able to have helicopter visibility on what is being used where.
It is also suggested to automatically extract the transformation logic from the service using APIs (to retrieve i.e. the dataflow .json) which can be stored in source control or audited for best practice adherence.
Limitations: Like Tier C, limitations are dependent on the user’s own skills. That said, these solutions do have a limit in the volumes and complexity of data they can handle. Trillions of rows or highly complex data may not be viable with these solutions without first being pre-aggregated or transformed in an analytics layer.
TO CONCLUDE
THERE ARE MANY OPTIONS FOR SELF-SERVICE REPORTING IN POWER BI

There are many options to consider; each have their own use-cases & benefit
There’s no one solution that will fit every use-case; it will differ across individuals, teams, departments, and organizations. To decide who should use what and why, it helps to break it down into tiers and levels; a segmentation. This will help you to…
Define your strategy:
Make strategic decisions about which tools to use when, why & by whom.Enable & train users:
Identify the skill trajectory each user should be following for a given tool & how they will be trained.Create policy:
Know the options available and understand which are best for a user & their business question.Govern your platform:
Understanding how these levels should be used in accordance with your organization’s strategy & policies, then creating monitoring solutions for each level to ensure compliance & governance.
UP NEXT
In part 2, we visualize the other dimensions of self-service, looking at learning paths. Click the below image to read that article.