Track Changes in Power BI: Part 4 -Reports
CAN YOU DO SOURCE CONTROL WITH POWER BI REPORTS?
…yes, it’s possible — let’s first understand why by looking at the contents of a .pbix
pbi-tools is a command-line tool that enables Source / Version Control of Power BI (thin) reports and datasets. Much like the folder structure generated by Tabular Editor, pbi-tools creates a Report Layout structure based on files in the .pbix. In these articles, we go into the background of this tool & how to use it.
An important note if you are using Sensitivity Labels - files with Sensitivity Labels are currently not supported with pbi-tools. More info on that at the bottom of the article.
CONTENTS
Parts 1-3: Source Control for Power BI Datasets using Tabular Editor
Part 4-6: Source Control for Power BI Reports using pbi-tools
Review: The importance of Source Control
Intro: The Report Layout file of a pbix
(Part 5 - April 5, 2022) Tutorial: Using pbi-tools for Source Control of thin reports
(Part 6 - April 12, 2022) Extending the output: Additional use-cases for pbi-tools.
REVIEW
What is source control?: Source / Version Control is about creating and managing a process to manage, conduct & document changes in an asset. It’s keystone to a scalable and mature data solution to assure quality & sustainability in what is delivered to the business.
Why you need source control: Having a sustainable and consistent source control management process will lead to not only more collaborative, structured & efficient workflows, but also yield long-term benefits, paving the way for future innovations in teams and solutions.
SOURCE CONTROL PART 4
INTRODUCTION: THE REPORT LAYOUT FILE OF A PBIX
We need Source Control for Datasets and Reports
Prior articles (Parts 1-3) have been focused on tracking changes of a Power BI dataset; the tabular object model definition, including metadata with the actual M and DAX code that defines the objects, therein. However, the end-goal of our dataset is of course to create elegant and actionable business reports. We also need to have Source Control / Version Control for reports to scale our reporting solution & enable automation.
Reports have a lot of complexity and content, including not only visualizations, filters and formatting, but also themes, images and even custom content like custom visuals. In most cases, each dataset is expected to have multiple downstream reports, each of which may contain numerous different pages. We need an efficient way to manage this content in a sustainable, scaleable manner. But how do we do this for a report; all we have is the .pbix, which is connected to the dataset? This is where pbi-tools comes in.
pbi-tools - Report source control & layout structure
pbi-tools is an open-source (free), command-line tool that enables just this. After installation with just one command we can extract all of the metadata from our report, including the theme, any images used, but most importantly, the definition of the report layout. A fantastic quick-start guide has already been written by the author of pbi-tools, Mathias Thierbach.
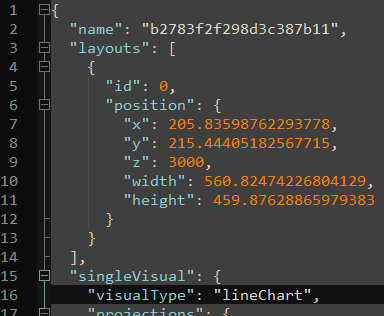
pbi-tools does much more, but lets start by examining how we get the output. Most of the output (images, theme, etc.) are clear and need no explanation; the novelty lies in the Report Layout structure. The structure of the ‘Report’ folder generated by pbi-tools is a deserialized, hierarchical tree of the objects in the report, from sections (pages) to visualContainers (visuals) and their respective configuration. To understand and use this output, though, we need to know where it comes from - inside of the .pbix.
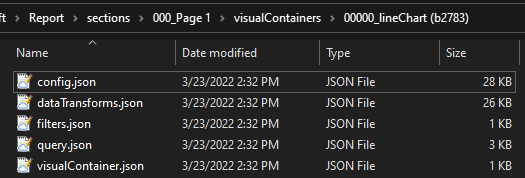
Report Layout structure - An example output from pbi-tools run on a thin report.
The Guts of a PBIX file
Gmail recognizes the .pbix as a zip archive and will preview the file contents.
.pbix files are a proprietary compression format containing data & metadata from both models & reports. Interestingly, it’s well-known that the .pbix contents can be accessed by treating the file like a .zip archive. This is even done automatically by some applications such as Gmail, which offers a preview of a .pbix by showing the file contents therein. You can access these contents yourself, manually, simply by changing the extension from .pbix to .zip and opening or extracting the archive.
The file contains various information which compiled together produce the Power BI report and dataset. Manipulating this information can produce some interesting and useful results.
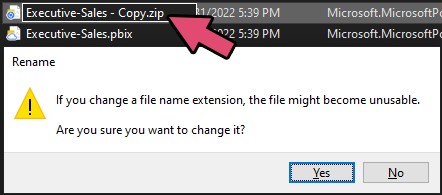
Changing the extension
First, a warning: Handling your .pbix file like this can be dangerous; changes or removals can corrupt the file, resulting in not being able to re-open it. Ensure you take a back-up of the file before exploring the contents like this.
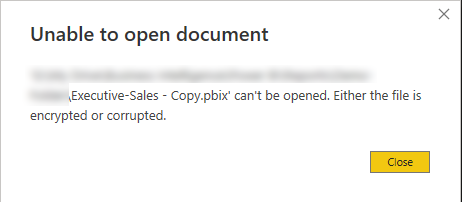
What happens when you remove or change something accidentally that you needed.
PBIX Contents
The file contents of the .pbix are not well-documented. Most are easy to understand, like DataModel (which contains the compressed data) and DiagramLayout (which has the definition of the ‘Layout’ tab in Power BI Desktop). You can even find any themes, images or custom visuals you used. A definition of each file is listed, below:
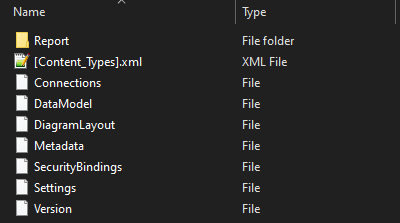
Opening the new .zip archive and looking into the contents
Note
Should you wish to modify the contents, you need to open them in Notepad++. You should not open the files in the native Windows Notepad text editor, as this will add an invisible byte order mark (BOM) at the front of the file when saving it [Reference], which can make it unreadable by Power BI when converting it back to .pbix.
-
Any custom visuals that have been added to the report, either from AppSource (imported from online) or added locally to Power BI Desktop.
Each Custom Visual will have .json files for the metadata (package.json) as well as the visual code.
Note that this will include any custom visuals that have been added to Power BI Desktop for this .pbix; it will not be limited to custom visuals that are used in the report.
-
This directory contains two folders:
RegisteredResources
These are the custom ‘resources’ added to the pbix, such as:Theme .json files
Images imported into the report or canvas/wallpaper background)
SharedResources
These are any resources that are added by default to the .pbix, such as default themes or organization-specific resources that are added to each report (i.e. from tenant admins)
-
This is the meat & potatoes of your report; the report definition. The file is a deeply nested .json with utf-16le encoding. If you open it plainly in Notepad++ you see that it has many escape characters; much of these go away once you parse the file as a json with the right encoding.
There is a lot of information in the layout file, including:
Report-level settings
Pages
Filters (Report, Page, Visual)
Visuals & Visual Settings
Which fields are used where in the report
Default information, like the default page, the default value for filters, etc.
The problem is that this information is very difficult to read. Even once structured and beautified thanks to pbi-tools, you need to know where to look to find what you’re looking for among the various key/value/array combinations.
The next article in this series goes through this Layout file in detail, examining and mapping the parts so we can find what we need.
-
XML file describing the content types for some of the files in the .pbix
-
A .json file that contains the connection string and parameters for your report.
-
The compressed data that is loaded into the data model.
If you delete this file and change the .zip back to a .pbix, you have a perfectly usable thin report, which can be re-connected to the published dataset and will continue to work fine.
-
A .json definition of the layout of the model diagram in Power BI Desktop.
You can auto-format this in some external tools, or programmatically yourself, to turn it from a grey-and-black spaghetti into neatly structured pages.
You can safely delete this file and it will automatically re-make a ‘default’ DiagramLayout when you next open the .pbix.
-
A short .json file which describes some basic metadata about the .pbix:
Version
If auto-creation of relationships are enabled
If the report was created in Power BI Desktop or Service (then downloaded to desktop)
Which release the report was created on
> This is particularly useful if you want to see when a .pbix was first created, since Power BI has monthly releases.
-
It is difficult to find any useful information about this file.
This is a binary file (not human-readable) appears to contain information relevant for i.e. Row-Level Security (RLS) for the respective dataset connection. Of course, our RLS is defined in our data model and applied to our report, so what is this file doing, here? From what I can find, the connection between the report & dataset is the binding, so my guess is the SecurityBindings file contains information to facilitate this connection and the RLS.
If you delete this file, it will be re-made automatically by Power BI Desktop when the .pbix is opened.
-
Contains additional metadata information for the report settings:
Version
ShowHiddenFields
IsRelationshipAutodetectionEnabled
IsQnaEnabledForThisFile
RelationshipImportEnabled
-
Scalar value for the version (i.e. 1.25)
Use-cases for modifying the contents of a .pbix
This is something that has been covered by others in the past; there are ways to exploit this to do little time-saving tricks with your .pbix:
1. Separate a dataset & report: Delete files & convert the .zip back to .pbix
Delete the data & keep the Power BI report:
If you delete the ‘DataModel’ file, you will be left with only the report; the data model & in-memory data are deleted. You can then connect the .pbix to the published Power BI datasetDelete the report & keep the Data Model:
If you delete the ‘Layout’ file inside the ‘Report’ folder, you will be left with only the data model.Delete or programmatically reformat a messy Diagram Layout
If you have many Diagram Layout tabs, or it’s a mess and you want to start over, you can delete the ‘DiagramLayout’ file to start over. You can also programmatically alter this JSON file to generate a cleaner layout, i.e. by making the height & width of each table the same, setting a distance and
2. Switch / replace report data source connections: While easy to do in the Power BI UI, you can also change the connection strings in the ‘Connections’ file, which will alter the data source you are connected to.
3. Extract images from a Power BI report, as well as backgrounds, themes & custom visuals:
You may need to recover this information, or remove it when inheriting a report from someone who didn’t share the theme or images. Inside the ‘Reports’ folder are other folders which contain additional information
StaticResources\SharedResources
Contains default or shared resources, like images and themes.StaticResources\RegisteredResources
Contains custom resources loaded into the file, like images, backgrounds & themes.CustomVisuals
Contains information & metadata related to Custom Visuals used in your report.
AN IMPORTANT LIMITATION
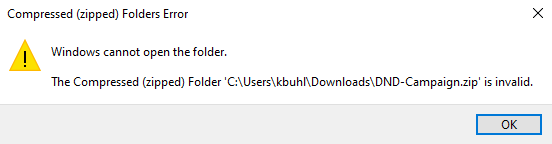
Note that if you are using Microsoft Information Protection with Sensitivity Labels, that it is no longer possible to access file contents in this way. Any .pbix files (Reports or Datasets) with a sensitivity label cannot be decompiled manually or with pbi-tools, at this moment. If you try, you will get an error that the archive cannot be accessed, as it is not a valid zip file.
Thus, if you have mandatory label policies, there is presently no way to enable thin report source control.
A pbix file with sensitivity labels on cannot be accessed like a .zip
Using pbi-tools on a pbix file with Sensitivity Labels enabled will result in an error
TO CONCLUDE
Source Control / Version Control is needed for Reports as well as Datsets
pbi-tools is an open-source, external tool that enables Source Control of “thin” reports
pbi-tools extracts pbix contents, i.e. themes, images & a deserialized layout structure
These contents can also be accessed manually by changing the extension to .zip
Accessing pbix contents this way is not possible if sensitivity labels are used