 DATA GOBLINS
Basic Line Charts in Power BI
From the archive. Published 3 years ago. Power BI and Fabric have changed since, so parts of this may be out of date or describe features that no longer work this way.
HOW TO MAKE BETTER LINE CHARTS
…by leveraging formatting options using only the core visuals (i.e. without custom visuals or SVGs).
TRENDS AND TIME SERIES - LINE CHARTS

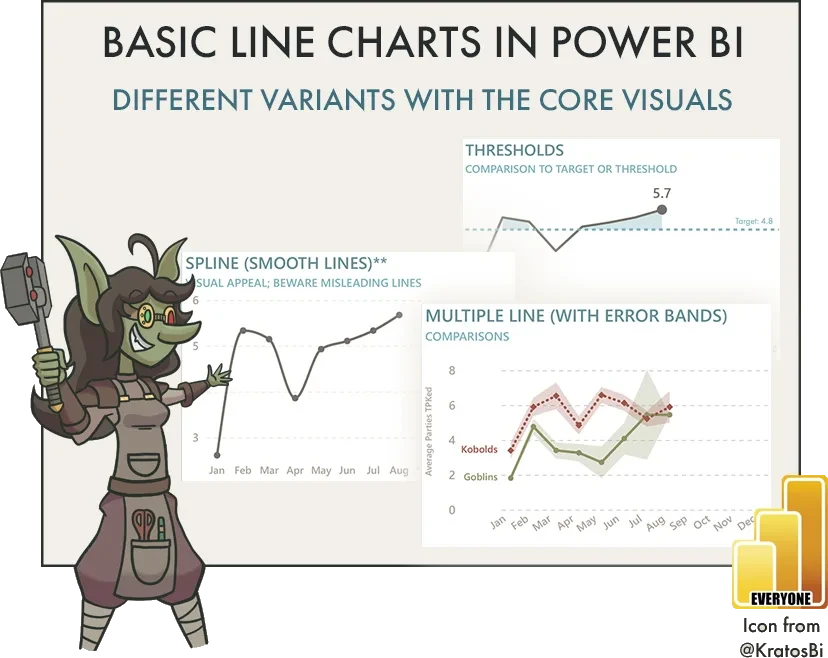
Line charts are another common chart type in reporting. They show time series or continuous data along an x-axis (typically). Like bar charts, they are easy to read and understand for most people. There are different variants and formatting for line charts to use them effectively.
- Area charts shade the area under the line, which can help visualize magnitude.
- Labeling or highlighting a data point is useful to draw attention to areas relevant for the user and reduce the time for them to get insights from the chart.
- Error bands/bars let you show uncertainty or variation, which is important when visualizing a central tendency like average or median, or when you need to share uncertainty as context, like with forecasting.
These are only a few examples; there are many more. Knowing how to create these different line chart variants is important to address these use-cases. Many of these formatting options are now possible (and quite easy to do) from the core Power BI visuals. However, it’s important to know the specific use-cases, and when you start to enter “MacGuyver” territory. For example, you can now recently create “smooth” line charts, something that has been highly demanded due to visual preference. Although, smooth lines can be misleading, as they have the potential to mislead about trends and patterns in the data.
Examples of different ways to use line charts with the default Power BI visuals
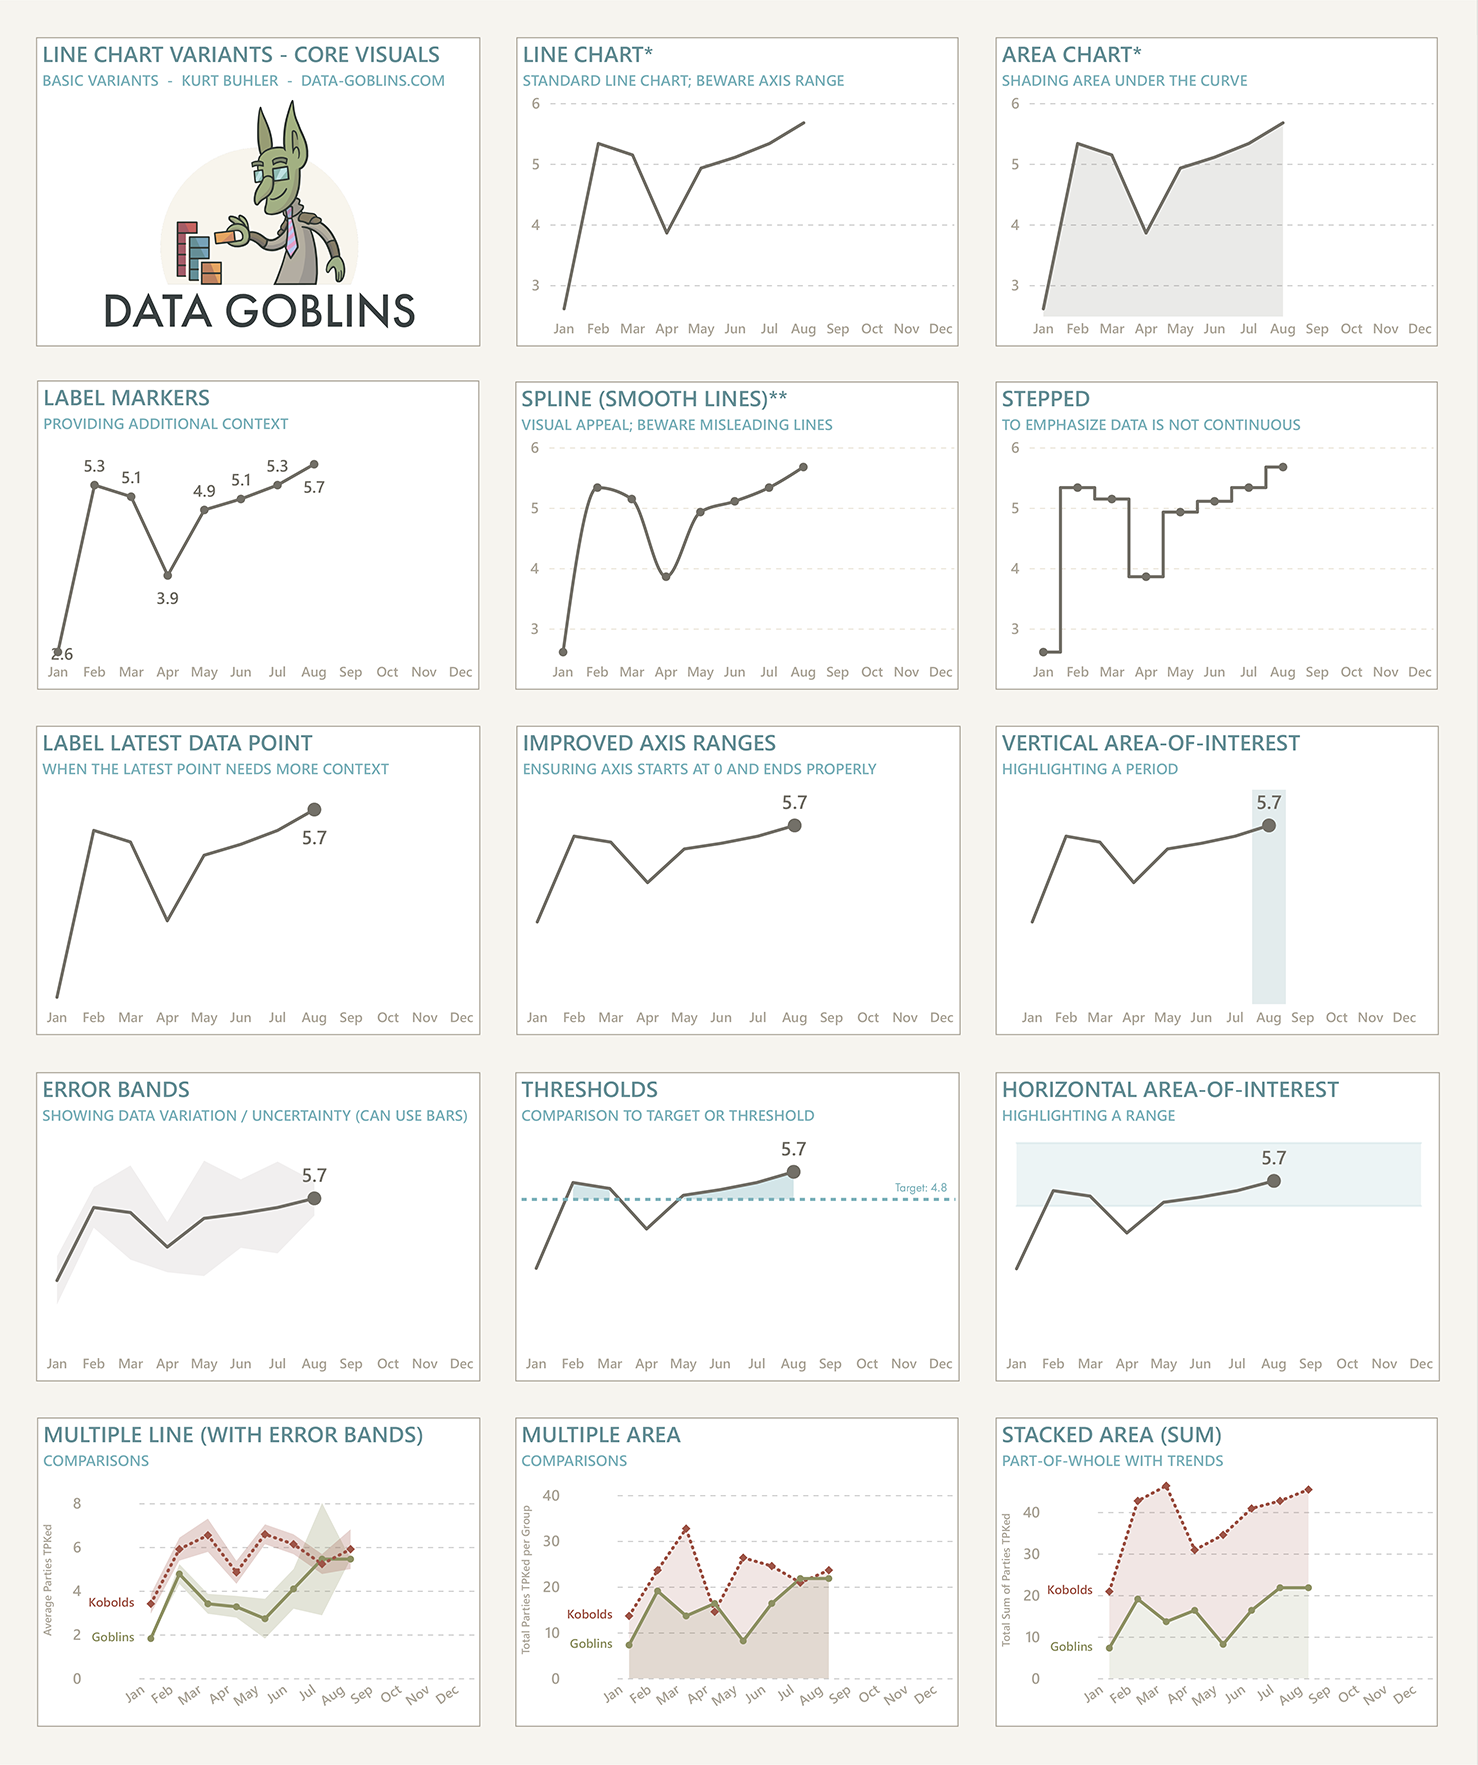
CHART CHOICES
In any reporting tool, you have to choose between chart types and the formatting options available. These choices have functional consequences; they are not purely for aesthetic reasons. You should make the right choices depending on your data and the business problem being addressed.
Consider the following examples:
- Area charts can take longer to read when comparing series, because the additional “ink” to fill the area can obstruct other series behind it. This becomes more difficult with more series.
- Data labels and markers take additional real estate and provide extra context, which might not be necessary. Often, the most important context is simply the shape of the line, and the highest, lowest and latest data points. Providing extra, unnecessary context results in users needing to spend excessive time on reading and interpreting a chart.
- Choosing between linear, smooth and stepped lines should be done carefully. Generally, the more continuous the data, the safer it is to use linear and smooth lines. For highly discontinuous data, you should instead opt for stepped lines, so as to not give the impression of trends for data that’s not there.
- Error bars and error bands are very important when you plot averages and forecasts. Not providing this information robs users of context that is critical to their decision-making. It’s essential to be sufficiently transparent and explain what this information means. Not showing this information (or worse, intentionally showing reduced error bands by plotting Standard Error of the Mean or altering the uncertainty intervals) are even considered unethical practices and data manipulation that are punishable in some professions or sectors.
By making well-motivated and justified decisions about your chart types and their formatting, you can ensure that your reports are not only elegantly designed, but also effective in helping people answer their questions.
FORMATTING CONSIDERATIONS IN POWER BI
In Power BI, the line chart type has significant formatting considerations and limitations. It’s important to be aware of these limitations, where you instead must turn to custom visuals like Deneb or the Python seaborn library.
Below are some examples of these limitations and considerations.
- Conditional formatting of lines: You cannot conditionally format line color, size, or shape. Instead, you need to create discrete series that overlap at fixed intervals.
- Conditional formatting of axes and legends: Presently, you can conditionally format axes and legends, but this conditional formatting does not properly handle the filter context. This means that if you have an X-axis of 12 months and want “Aug” only to show up as blue, you can’t. It’s not possible for the visual conditional formatting to understand which axis label is “Aug”. In my opinion, this is a bug or flaw in the existing implementation of conditional formatting, as was the case with data labels in the past.
- Labeling data points: There are a lot of limitations with data labels. You can’t position labels to the right (or left) of a marker, unless you go into some deep MacGuyver waters.
- Overlapping axes: You cannot overlap densities or chart types to create joy plots or ridge plots. Further, you can’t use line charts along the axes of other chart types like bar charts, histograms or scatterplots to show distribution with joint plots.

TO CONCLUDE
Line charts are used in many Power BI reports, particularly if there are functional dates in your data. However, there are many ways that you can make line charts more effective for report consumers. Ensure that you suitably match your formatting choices with the use-case. Avoid making choices purely for aesthetic reasons, and ensure that users can effectively answer questions they have about the data without spending too much time reading and interpreting the chart.