 DATA GOBLINS
Bar Charts in Power BI
From the archive. Published 3 years ago. Power BI and Fabric have changed since, so parts of this may be out of date or describe features that no longer work this way.
HOW TO CREATE BULLET CHARTS IN POWER BI
…and other chart types using only the core visuals (i.e. without custom visuals or SVGs).
YOU COULD ALWAYS USE A BAR CHART…
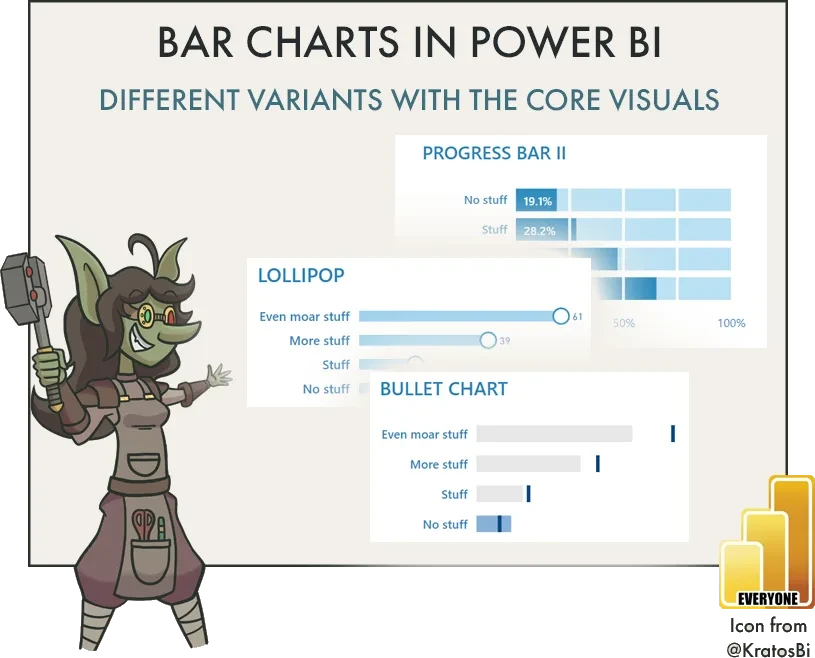
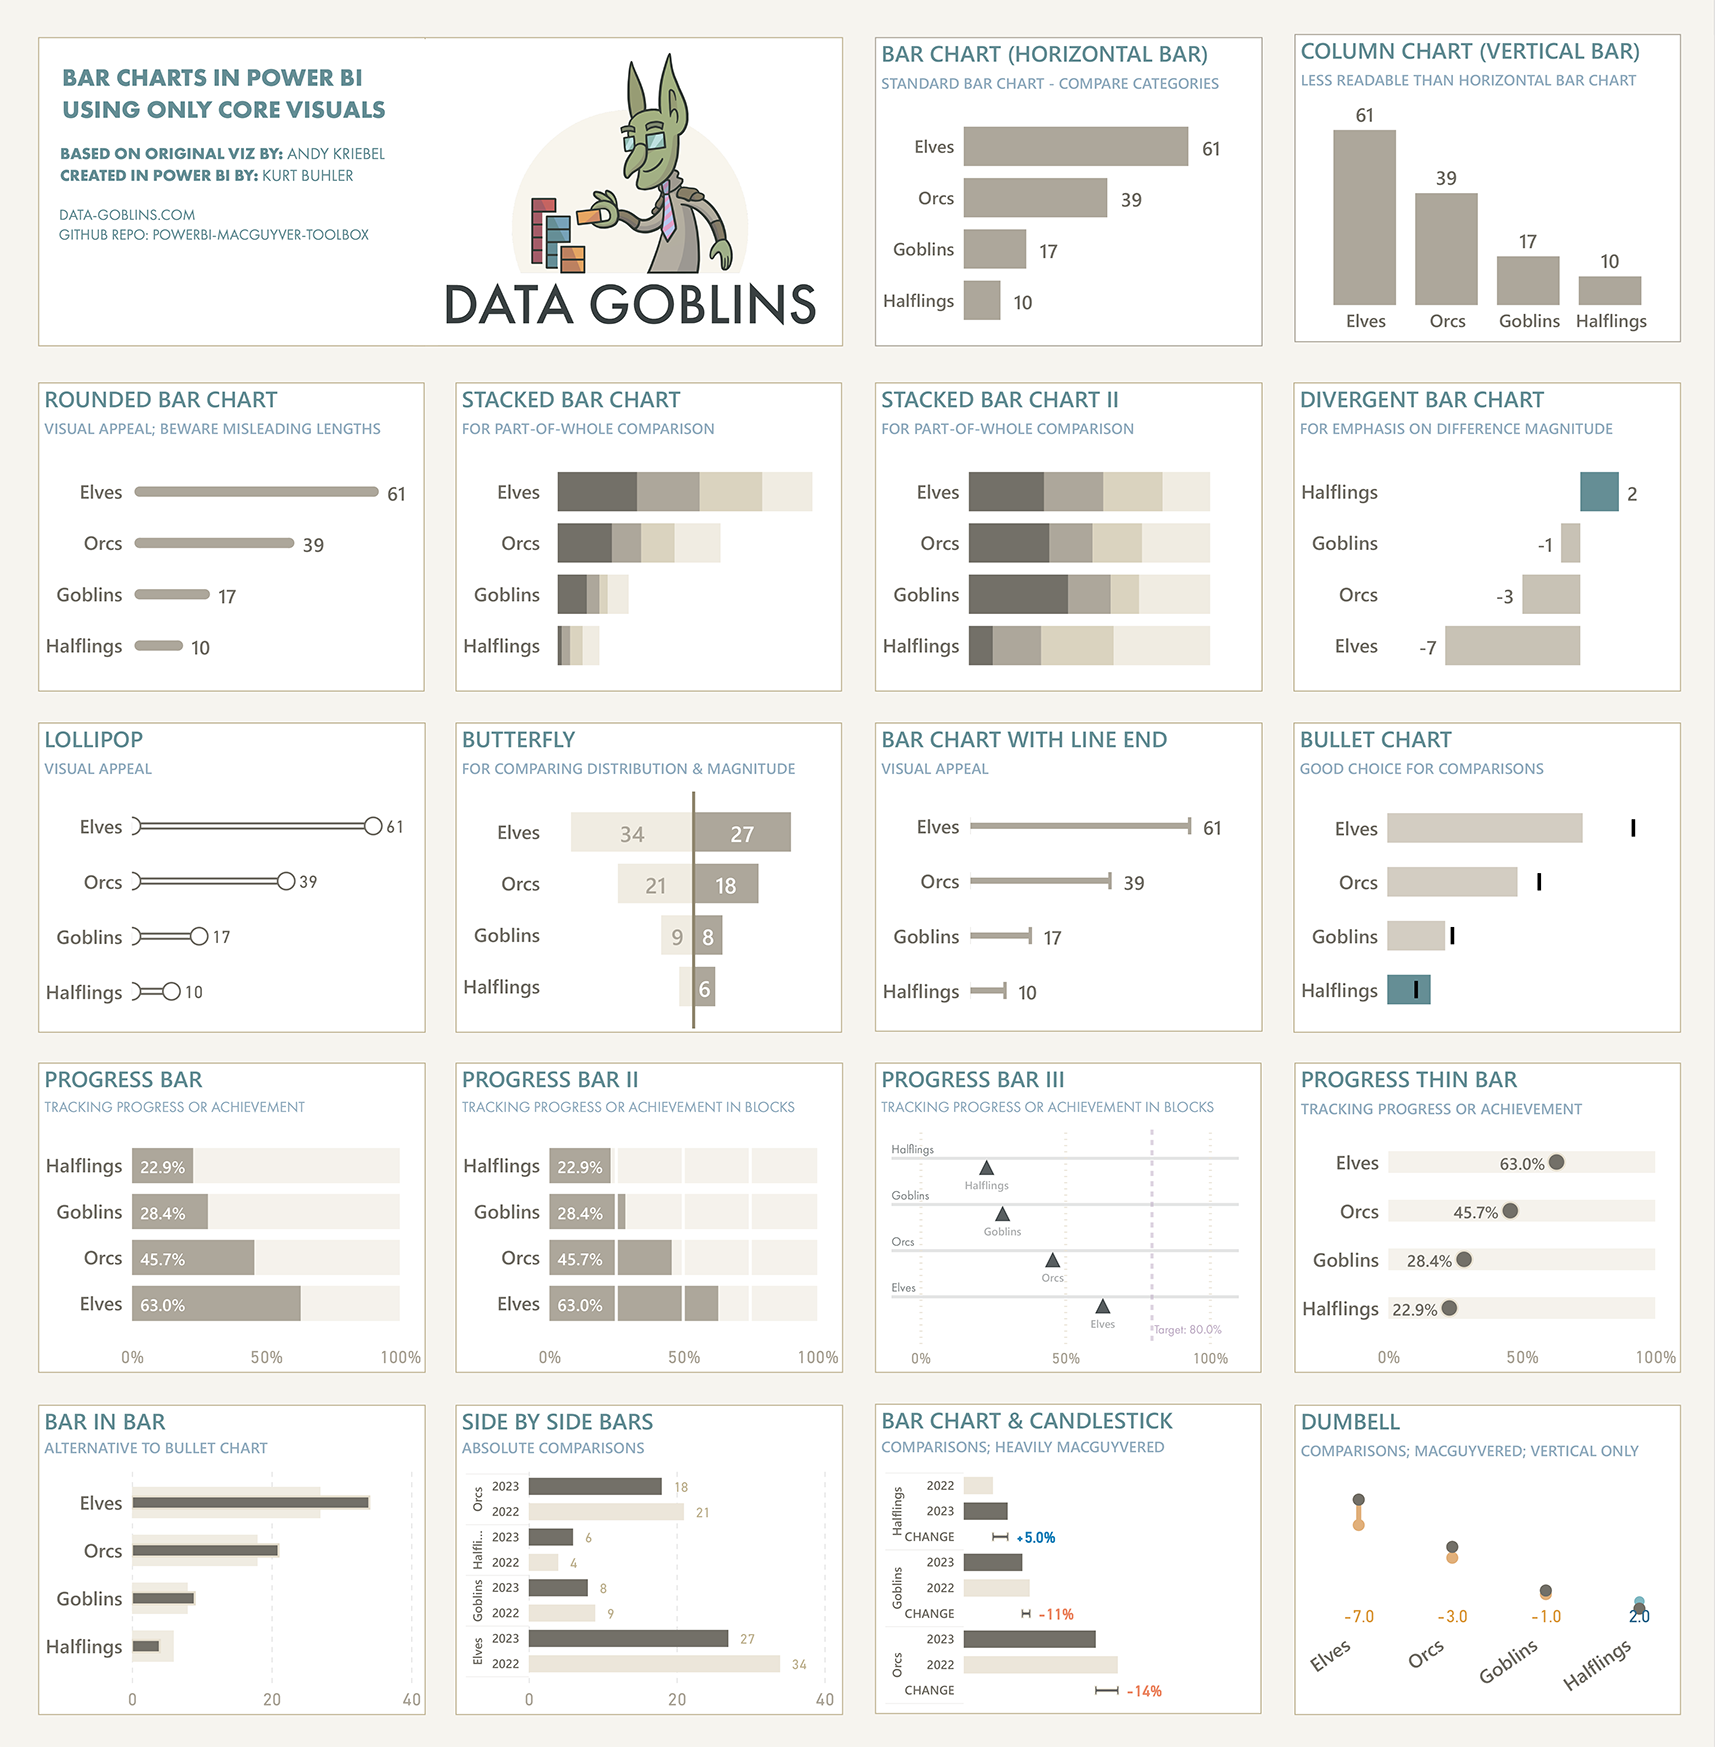
 Bar charts are the most commonly used cartesian chart type in Power BI. They are simple, useful, and easy to understand. However, there are many variants of these charts that you can use for different use cases:
- Bullet charts help you track figures against a target for different attributes in a concise and elegant way.
- Divergent bar charts can be more effective ways to focus on the magnitude of difference between figures and a target instead of than the absolute values.
- Stacked bar charts let you compare absolute volumes while also seeing part-of-whole for a second dimension.
These are only a few examples; there are many more. Knowing how to create these different bar chart variants is important to address these use-cases. While many of these visuals can be created custom in Deneb or from SVGs, you can also create them in the core visuals. However, it’s important to know the limitations of the core visuals in Power BI, and when this “Macguyvering” of the core visual formatting settings goes too far.
Examples of different ways to use bar charts with the default Power BI visuals
REPORTING OBJECTS
Over time, Power BI is becoming more flexible and supports more visualization types and use-cases. For instance, I created all of the above templates in only 5 hours (in part, thanks to the productivity enhancements of Tabular Editor 3 when writing DAX). However, this flexibility comes at a cost — the more Macguyvering you do, the more the model becomes cluttered with report-specific objects.
Report-specific objects are measures, tables and columns created to fulfill specific visual requirements, instead of addressing a broader range of business data needs. When unsegregated from the rest of the semantic model (Power BI dataset) they make it more difficult to use and find what you need. This is particularly true for model consumers in managed self-service scenarios. To date, there are no out-of-the-box solutions to consistently and elegantly isolate report-specific objects from the model. Instead, it’s essential that you:
- Organize these objects into display folders and tables, away from other model objects.
- Hide them or mark their parent tables as private so that they don’t clutter the model.
- Place report-level measures in the report file, or or in a downstream composite model.
- Limit the number of reporting objects as much as possible.
Also consider that the more you Macguyver a visual, the harder it is to understand and maintain. Just look at the templates I’ve shared above. For example, the “bar chart & candlestick” template looks really nice, but it’s an absolute pain in the ass to understand, adjust, and maintain. For chart types like this, it’s debatably better to use Deneb, until additional features come out that provide the native flexibility for the core visuals. Furthermore, you always should critically appraise whether your desired visual is the best option. Sometimes the simplest solution is best; don’t strive for whatever looks best to you or what seems the most unique.

TO CONCLUDE
Bar charts are the most common cartesian chart type used in Power BI. However, there are many sub-types of bar charts that you can use for different use-cases. Ensure that you are aware of the different ways that you can format the bar chart core visuals to make the most of these different subtypes and formatting options, so you can most effectively visualize and explore your data.
However, consider carefully the cost of Macguyvering visuals in Power BI. Remember that elegance is not only how something looks, but how effective it is in delivering insights over the solution’s lifespan. That includes ensuring that the visual is flexible for different users and use-cases, and also easy to adapt and maintain.