# How to make a Waffle chart without custom visuals in Power BI
> We look at a method for creating waffle charts in Power BI with the default visuals.
- URL: https://data-goblins.com/waffle
- Author: Kurt Buhler
- Published: 2020-10-10
- Topic: Reports and visuals
# DISPLAY DATA IN A WAFFLE CHART
*…using **default visuals** in Power BI*
---
[](https://t.co/OZfnEumh3k?amp=1)
*Waffle charts are advanced chart types which can be useful to show parts of a whole. However, they are not a default chart type in Power BI, and it is difficult to make one that is not a fixed grid. Still, they have their use-cases and can be a fun chart to experiment with making.*
---
Time to ImplementDifficultyUsefulness
---
# Use-Cases:

**IMPLICIT MEANING OF EACH DOT:**
A waffle chart is different from pie, doughnut and tree map charts in that it is a fixed number of dots arranged in a grid. Each dot therefore can be assigned a meaning since each conditionally filled dot is 1%. To a user, this might be more implicitly meaningful than another chart type.

**VIS FOR PARTS OF A WHOLE:**
Any time you need to see how much something comprises of a total, you have many chart types to select from. It’s always hard to make the right decision. In the end, however, the answer is ‘anything but a pie chart’.

**TARGET ACHIEVEMENT:**
If each percent counts, a waffle chart can be a good way of illustrating progress to a target. For example, if a sales person achieves a different bonus at each % achievement, it is good for them to see that progress. Watching each day to see how many more dots they get can be a satisfying visual hook for them.
---
# When to not use it:
**IF THE ABSOLUTE VALUE MATTERS:**
If the percent contribution or achievement to the whole is not as relevant as the absolute amount, then a waffle chart is not a good visualization choice.
**IF SOMETHING SIMPLER WILL SUFFICE:**
A waffle chart is not a commonly used visualization option, particularly in Power BI reporting. Thus, there may be other visualization options that are either more appealing or merely simpler for users to understand. Where a waffle chart excels is when it adds value, not simply because it is uncommon and can make your report unique.
---
# How to do it - Ingredients:
**DATA STORAGE MODE:**
- IMPORT
- COMPOSITE
**METHOD:**
- POWER QUERY
- DAX
- (A LOT OF) VISUAL MACGUYVERING
**ELIGIBLE WITH:**
- SCATTERPLOT
---
# How to do it - The Recipe:
*I first learned and adapted this from *[*this youtube video by **Chandroo**.*](https://www.youtube.com/watch?v=OZPc42xnv8s)
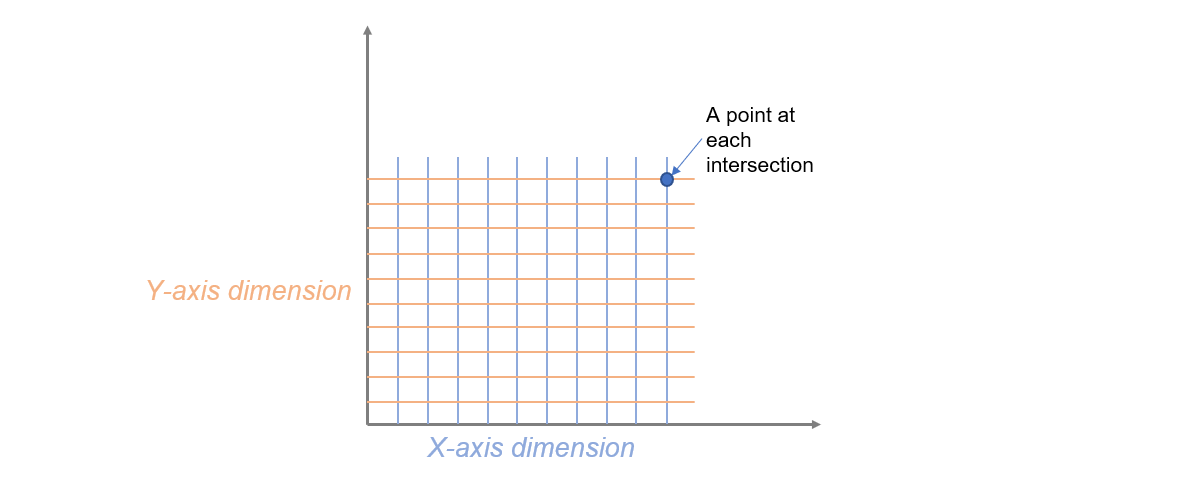
We will be ‘macguyvering’ a waffle chart from a scatter plot. To do this, we need to create a 10 x 10 grid (for a 100% waffle where each ‘dot’ is 1%). Thus, we need to have an X-axis dimension and a Y-axis dimension each of which have 10 values, as well as a means to populate the dots at each intersection of this hypothetical grid.
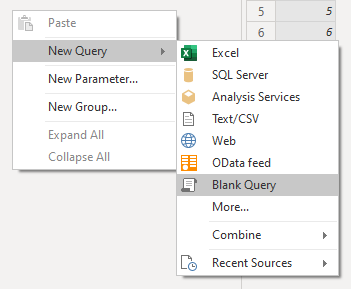
## Step 1: We should open Power Query editor and start a blank query. This will be the start of the table we will use for our ‘Grid’. Call it “Belgian_Waffle”.
## Step 2: Create a list from 1-10 as the first step.
= {1..10}
## Step 3: Convert the list to a table and re-name the column to ‘Y-Axis Dimension’


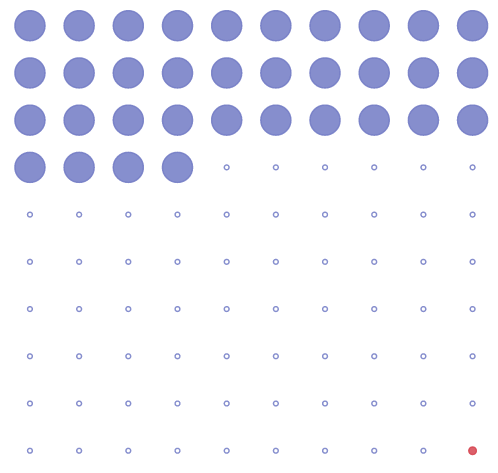
## Step 4: Here you already need to decide on the design of your waffle. If your waffle will be filled in **top-down** (like in the header image), then you need to **sort this column descending**. If your waffle will be filled** bottom-up**, then you continue to Step 5.
## Step 5: If your waffle will be filled **left-to-right,** Add and expand a custom column that is another list from 1-10. If your waffle will be filled **right-to-left,** you will have to add another custom column that subtracts this second list from the number 11.
### Left-to-right
= Table.AddColumn(#"Renamed Columns", "X-Axis Dimension", each {1..10})
### Right-to-left (continuing from above)
= Table.AddColumn(#"Expanded Column", "X-Axis", each 11 - [#"X-Axis Dimension"])
= Table.RemoveColumns(#"Added Custom1",{"X-Axis Dimension"})
= Table.RenameColumns(#"Removed Columns",{{"X-Axis", "X-Axis Dimension"}})
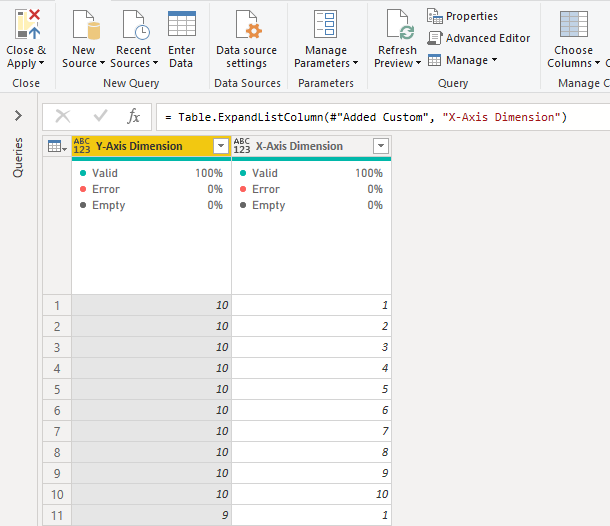
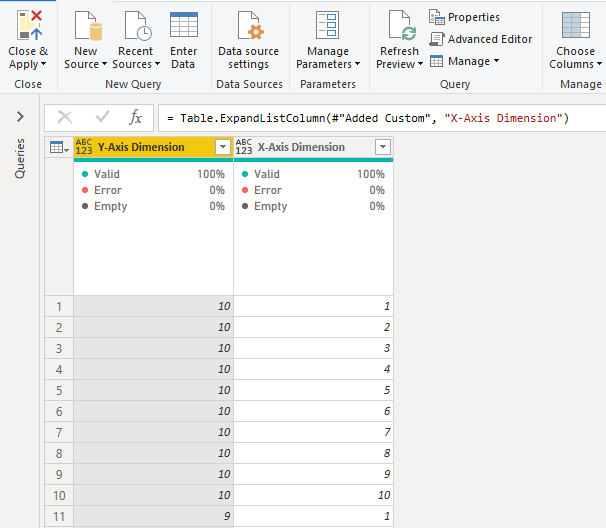
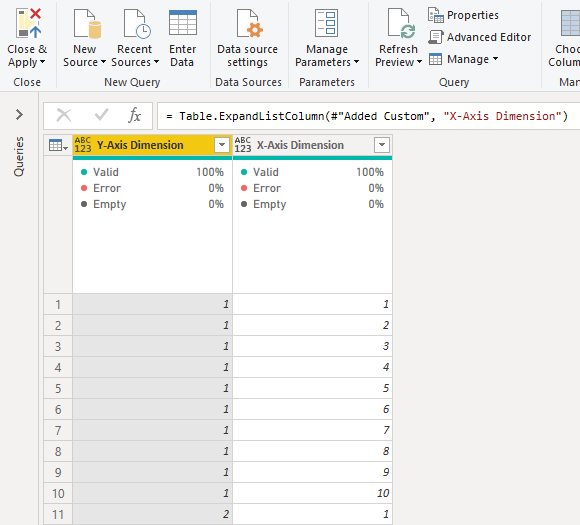
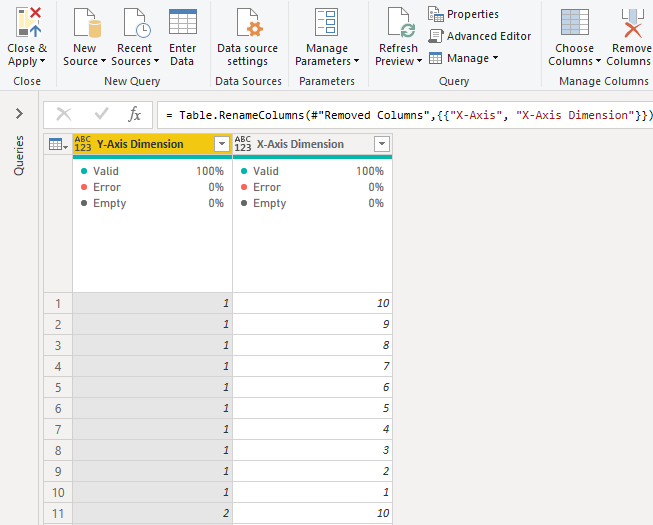
What we are doing is basically deciding the directionality of our grid. In the next step, we will add an index that will count from 1-100. The directionality of that index will be determined by the combinatorial order of these X-axis and Y-axis columns.
Top-down, left-to-right resultTop-down, right-to-left resultBottom-up, left-to-right resultBottom-up, right-to-left result
## Step 5: Create a new index column from 1. It should end at 100. Change the type of the other 2 columns to integer and click ‘Close & Apply’ to load your Belgian_Waffle.
## Step 6: You should already have some measure or metric that can be expressed as a percentage. For example, % achievement vs. LY, or in the case of the header image, % of life lived.
## Step 7: Create a new measure that will be used to fill the waffle. This measure will change the size of the shapes in the waffle as a ‘fill’.
Because our measure in Step 6 is a %, we need to convert this to a whole number by multiplying by 100, then rounding. Typically, it is best to round down, but there might be cases where you round up. For example, 99.9% achievement is still not 100% achievement - “close” only counts in horseshoes and hand grenades, as they say.
Anyway, we will do this using the DAX expression FLOOR().
Next, we need to compare our measure to the index of our newly created Belgian_Waffle. We will do this by saying if the measure % is greater than or equal to the MAX(‘Belgian_Waffle’[Index]), then it should return 1, otherwise it should return 0.
If a specific percentage is important, such as 100%, we can also call this out separately, here, for the sizing (either to be larger or smaller than the others). We do this by nesting another IF statement.
## Step 8: If certain percentages are important, you can call them out with conditional formatting. To do this, in the Belgian_Waffle table, make a **custom column** that conditionally specifies these values.

## Step 9: Alright, finally we can make / eat our waffle.
Drop down a new scatterplot. Place the ‘X-Axis Dimension’ in the ‘X-Axis’ field, and the ‘Y-Axis Dimension’ in the ‘Y-Axis’ field. Place ‘Index’ in the ‘Details’ area, and the measure in ‘Size’. If you followed Step 8, place the conditional column in ‘Legend’.
You should see the start of your waffle. All that is left is some formatting.
## Step 10: Turn off the axes, and legend. Under ‘Shapes’, reduce the size to -24 (ish) and change the shape if you like to a square or dot. Change the data colours as you wish.
Ta-da, you can now get some maple syrup to enjoy your Belgian_Waffle. You can further improve the visualization by adding some text box labels, or putting a KPI card next to it to call out the values.



 ## Step 1: We should open Power Query editor and start a blank query. This will be the start of the table we will use for our ‘Grid’. Call it “Belgian_Waffle”.
 ## Step 2: Create a list from 1-10 as the first step.
= {1..10}
## Step 3: Convert the list to a table and re-name the column to ‘Y-Axis Dimension’


## Step 4: Here you already need to decide on the design of your waffle. If your waffle will be filled in **top-down** (like in the header image), then you need to **sort this column descending**. If your waffle will be filled** bottom-up**, then you continue to Step 5.
## Step 5: If your waffle will be filled **left-to-right,** Add and expand a custom column that is another list from 1-10. If your waffle will be filled **right-to-left,** you will have to add another custom column that subtracts this second list from the number 11.
### Left-to-right
= Table.AddColumn(#"Renamed Columns", "X-Axis Dimension", each {1..10})
### Right-to-left (continuing from above)
= Table.AddColumn(#"Expanded Column", "X-Axis", each 11 - [#"X-Axis Dimension"])
= Table.RemoveColumns(#"Added Custom1",{"X-Axis Dimension"})
= Table.RenameColumns(#"Removed Columns",{{"X-Axis", "X-Axis Dimension"}})
What we are doing is basically deciding the directionality of our grid. In the next step, we will add an index that will count from 1-100. The directionality of that index will be determined by the combinatorial order of these X-axis and Y-axis columns.