# Power BI Report Checklist
> I list some tips for checking to make sure your report is ready for handover to someone else.
- URL: https://data-goblins.com/report-checklist
- Author: Kurt Buhler
- Published: 2022-09-01
- Topic: Reports and visuals
# IS YOUR REPORT READY FOR HANDOVER?
*Some tips to **prepare your Power BI report for handover & support**.*
---
[**PART 1:** HANDOVER OF DATASETS & REPORTS](https://data-goblins.com/handover)
CHECKLISTS
[**PART 2:** MODEL / DATASET](https://data-goblins.com/dataset-checklist)
[**PART 3:** DATAFLOW](https://data-goblins.com/dataflow-checklist)
**PART 4:** REPORT CHECKLIST
[**PART 5:** DASHBOARD](https://data-goblins.com/dashboard-checklist)
[**PART 6:** POWER BI APP](https://data-goblins.com/app-checklist)
---
## CREATING SUSTAINABLE REPORTS
Unsupported reports today lead to unused reports tomorrow.
**Chances are that you will not be working on the same report, forever.** The reports you make today will be passed on to someone else, eventually. This handover is often a challenge if the person wasn’t involved in designing or developing the report. Without the right hygienic and documentation steps, a lot of time is wasted trying to understand what was made. In [**Part 1**](https://data-goblins.com/handover), we discussed the mentality & activities needed for a successful handover. In [**Part 2**](https://data-goblins.com/dataset-checklist), we looked at some tips on how to improve handover of datasets. **So how can we improve the handover & support of Power BI reports?**
**In this article we look at some tips for improving report release and handover.** To do this, we go through a few checklists to ensure that:
- We have written **useful & concise documentation**
- The report has been **tested with different screens, filters & views**
- Some basic** best practices are applied**
---
## DOCUMENTING THE REPORT
**When you’re documenting a report, you need more information than a list of the visuals.** Having only screenshots of each report page labelling visuals is not going to be very helpful. It shows the same thing anyone would see if they just opened the report. While report documentation should include both text and labelled images, it needs a lot more context. There should be additional information about the business questions the report should answer, and what the intended user experience should be.
### REPORT DOCUMENTATION CONTENTS
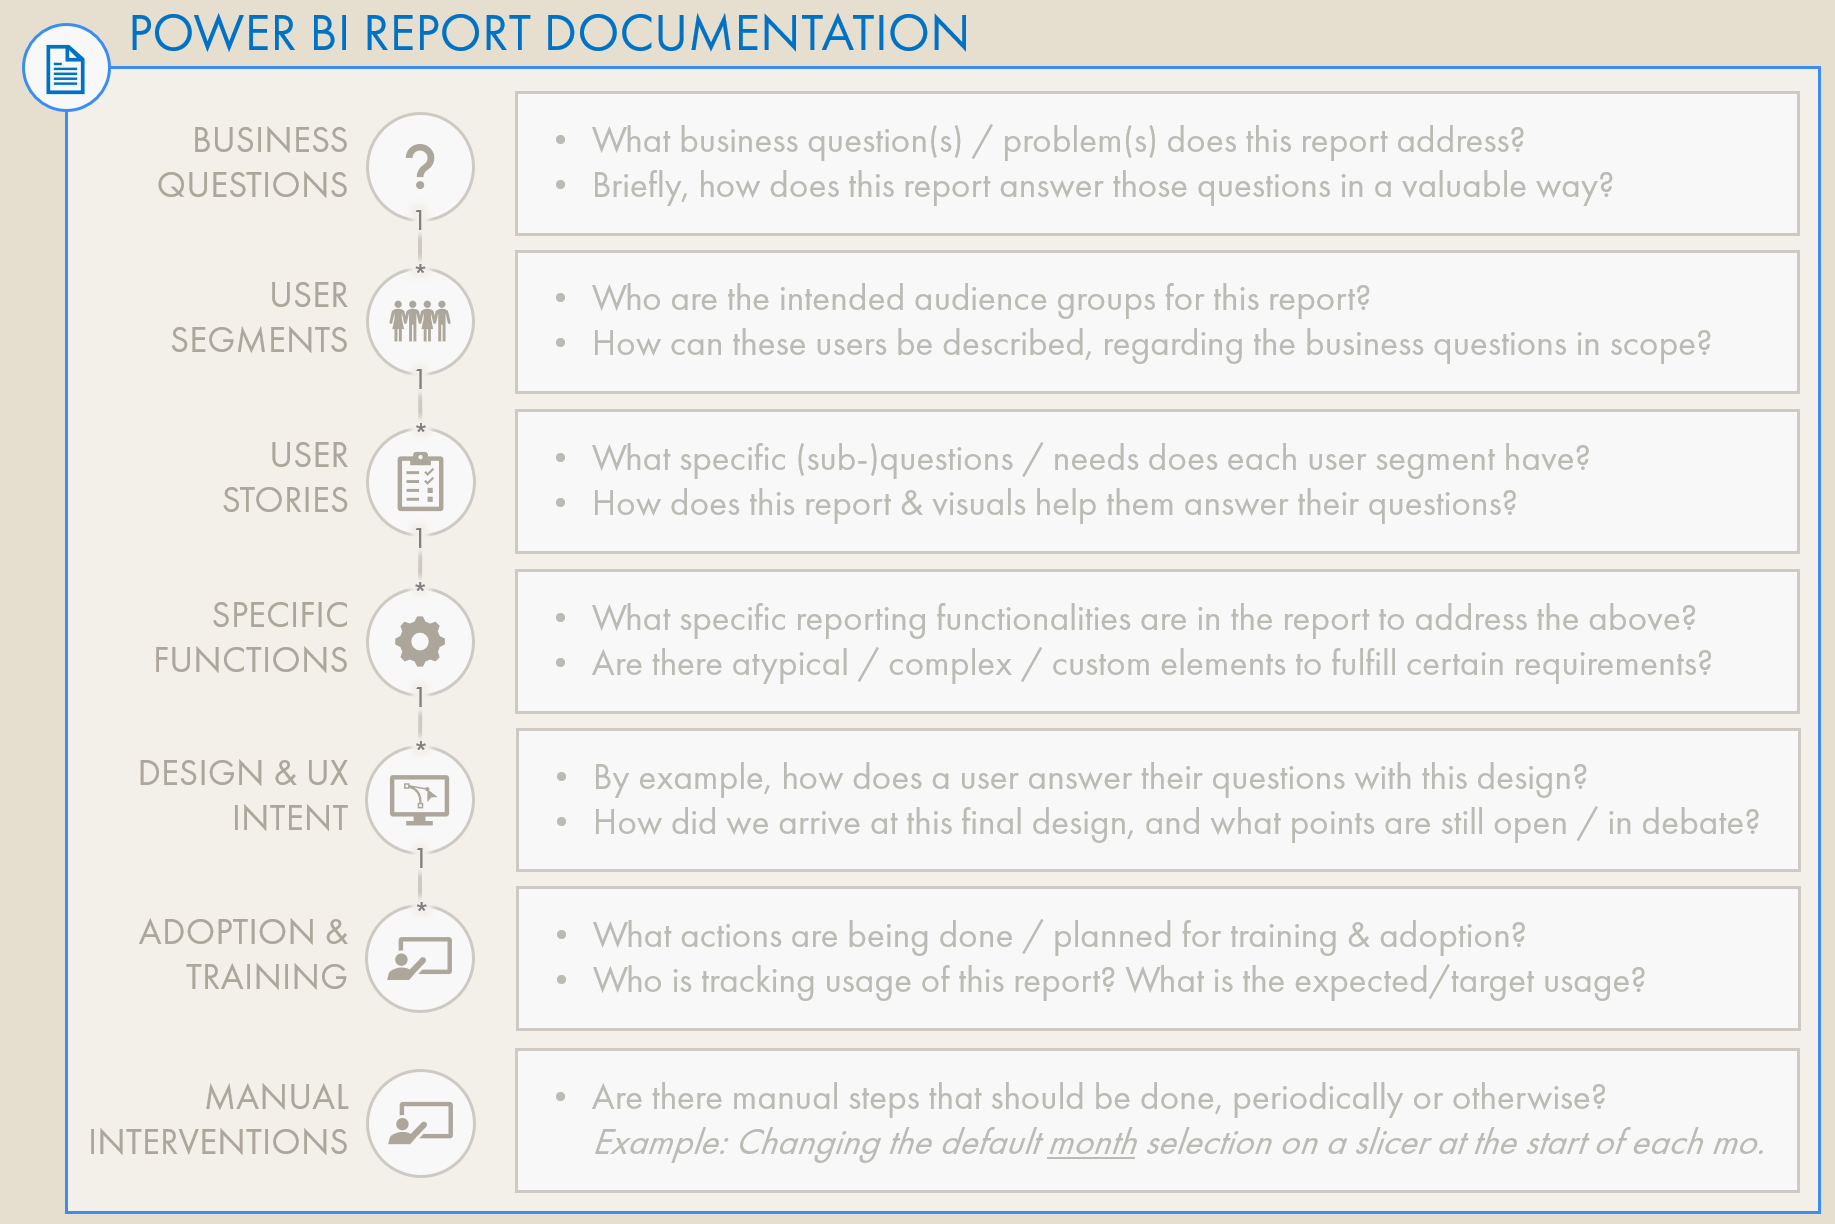
**So what should be in the documentation of a Power BI report?** One of the challenges is the difficulty in writing concise and actionable documentation. It’s very easy to be superfluous, unintentionally hiding important information among obvious or excessive descriptions. Instead, report documentation should start broad, explaining the business questions and how the report attempts to answer them, then zoom in on specific technical functionalities that are achieved through non-obvious means (AKA custom or Macgyvered visuals).
Below is an example of how Power BI report documentation might be structured. What’s key is that the focus is always on the business questions the report addresses. For a good report, this should be clear:
Basic information (i.e. Name, Owner, Workspaces...)
*(Content not available)*
Example structure for report documentation; further descriptions are in the drop-downs, below
*Every report will have the same set of basic information around it:*
- ***Who owns the report / Who is the SPOC / Who makes decisions about it?***
- ***In which workspace(s) is the report published? What dataset is it connected to?**
Is it used in more than one workspace?
Is it in deployment pipelines?
A governance solution might automatically collect this information (i.e. using the REST APIs)*
- ***Where do we find the latest .pbix file?**
I.e. SharePoint site? DevOps Repo?*
- ***What is the GUID of the report(s), their dataset(s) and workspace in Power BI Service?
**This is particularly important for using the API to get further information*
- ***What tools are used to manage the report?
**I.e. Power BI Desktop? pbi-tools?*
- … etc — More information can be added
***This involves some information about the business questions the report aims to solve.** Generally, a report should and can not try to answer every question. It is thus good to define explicitly the scope from both a data and a business point-of-view. *
*A good way to document this is using the output of the design; the mock-ups and prototypes that resulted from requirements gathering / co-creation workshops, for example.*
*Documenting the intended audience of the report is essential. Below are some questions to help you do this:*
- ***What different user segments or persona’s are there?**
This might be defined on the basis of roles, or other features that arose. Segmenting users is an exercise done to group people by their needs and questions.
I.e. Executives, Sales Region Managers, Sales Account Managers*
- ***What specific needs and pains does each group have?** *
- ***What questions are most important to each group?***
- ***What actions does each group take based on the data? What do they do with the data?***
- ***How much detail is needed to answer the questions of each group?***
- ***How does each group use the reports? What devices do they use, how much time do they spend using reports and when do they check them?** *
- *…etc.*
*Describing the questions and needs of each user group is essential to make a connection between “audience” and “design”. Each user group will have shared & distinct user stories, and there may be other subsegments inside these groups. *
*If you are new to this “question” based approach, a good way to think about it is below:*
- ***Report Question (Business Questions):**
What big questions does the **report** try to address? Concisely, how does it do that?*
- ***Page Question (Business Questions; User Segments):**
What big questions does this **page in the report** try to address? Concisely, how does it do that?*
- ***Visual Question (User Stories):**
What questions / user stories does this **visual** try to address? Concisely, how does it do that?*
*Filling this out for each report / page / visual is a good start.*
*Any atypical features of the report that warrant special attention or care, for example:*
- ***Bookmarks***
- ***Visual-Level Filters***
- ***Customized or ‘Macgyvered’ visuals***
- ***Code Visuals (R, Python)***
- ***Appsource Visuals (particularly Deneb, Charticulator)***
- ***Custom Visuals***
- ***Custom fonts or images***
- ***.svg visuals** *
- ***…etc***
*More detail about these things is also called out in the next section of this article.*
*The best way to address this in my opinion is with videos. Recording yourself explaining how the report is used from each user segment’s point-of-view; using the user stories to walk through the report pages and interactions. *
*This should be the link between the design and the questions / user stories / requirements. Each visual should have a purpose and justification; that should be clear in this part of the documentation.*
*It’s essential to document what is being done to train users to use the report. It’s not sufficient to have a single document or recorded video; multiple actions are needed:*
- ***Communication mails / newsletters***
- ***Teams groups or central repositories***
- ***Training videos***
- ***Training sessions***
- ***Request / Question forms***
*Further, adoption actions to promote the report are also necessary:*
- ***What are the usage targets? What is expected?***
- ***Who is following up the usage?** *
- ***How frequently is usage being tracked?** *
- ***Are users allowed to export data from this report?** *
- ***Are there elements that are not being used, or not used as intended/expected?***
***Ideally, everything in the reportis automated and manual intervention is not necessary.** In reality, however, this might not always be true. Maybe because of capacity constraints, limited access to technology or resources, or other reasons, part of the report requires the intervention of a developer. For example, a default slicer value or bookmark that needs to be changed.*
***If manual steps exist, it’s essential to identify them and justify their existence.** Just doing this is a critical thinking exercise that might help you see more sustainable solutions missed. But if the manual step is absolutely necessary, you can at least make it clear. At minimum, clarify what it is and provide step-by-step instructions on how and when to perform the task. This is best done with visual aids, either in a separate section for each item, or annotated videos.*
### WARRANTING SPECIAL ATTENTION: VISUAL FILTERS & CUSTOM STUFF
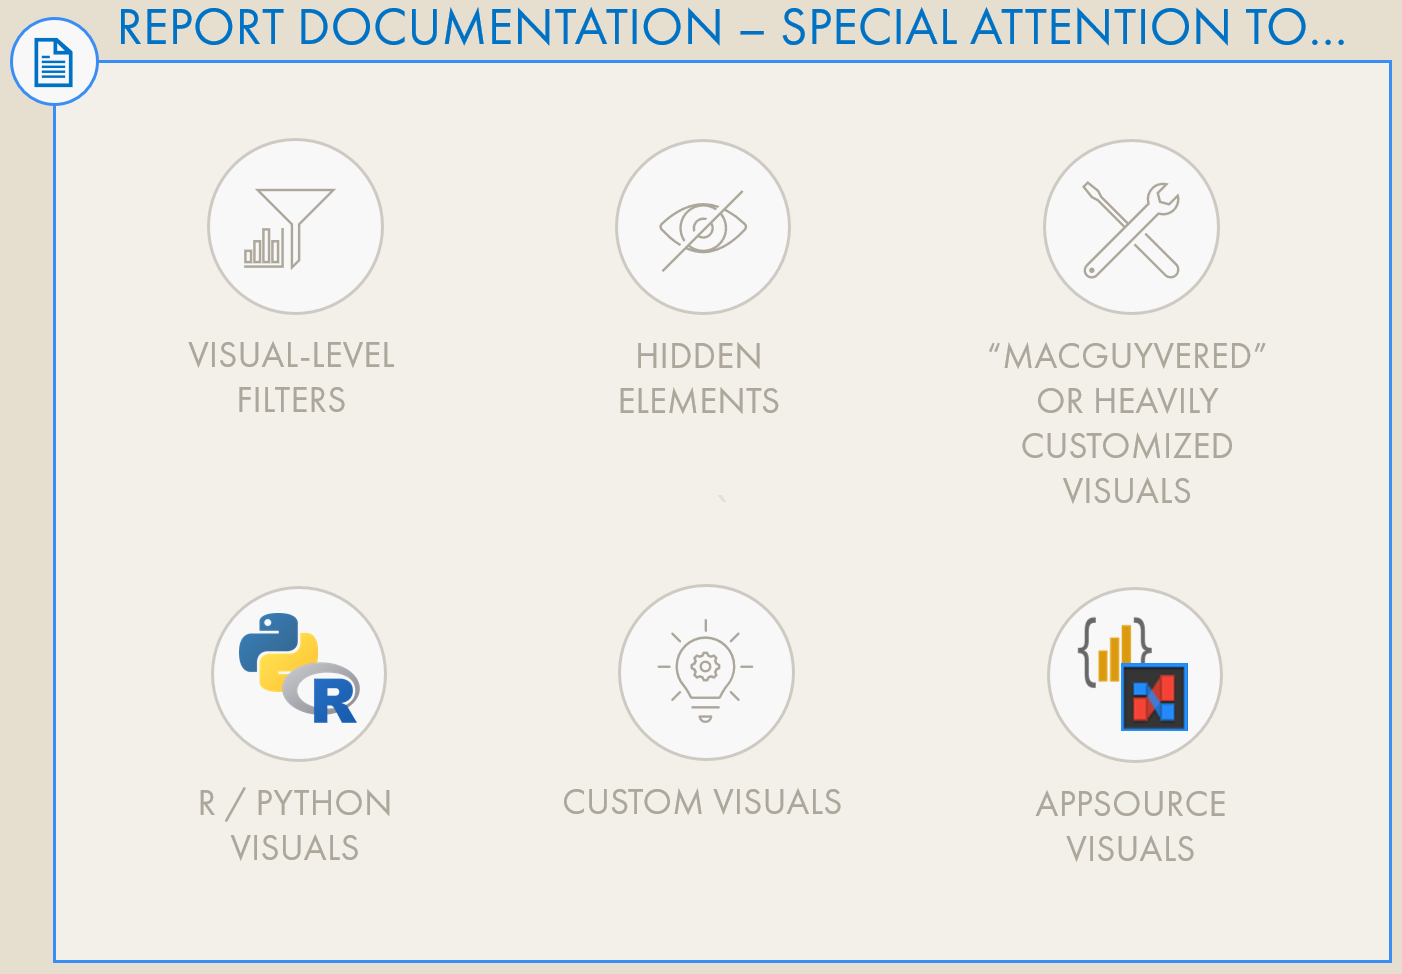
**In Power BI reports some things are particularly important to document**, either because they are custom/complex, non-obvious, or literally hidden. Note that complexity is not bad, but unknown or undocumented complexity is a risk. Without some of these methods / tools, we wouldn’t be able to fill many (most?) visualization requirements in a Power BI report. While these mentioned above under “*specific functions*”, they are elaborated here for clarity:
- **Visual-level filters:**
Too often, time is spent troubleshooting an “incorrect” visual when it’s eventually discovered that the problem was a visual-level filter no one noticed or everyone forgot. There is nowhere in the report which will draw your attention to these; they only appear when selecting the visual. It’s thus important to raise them explicitly in documentation, i.e. in a table of “visual-level filters”.
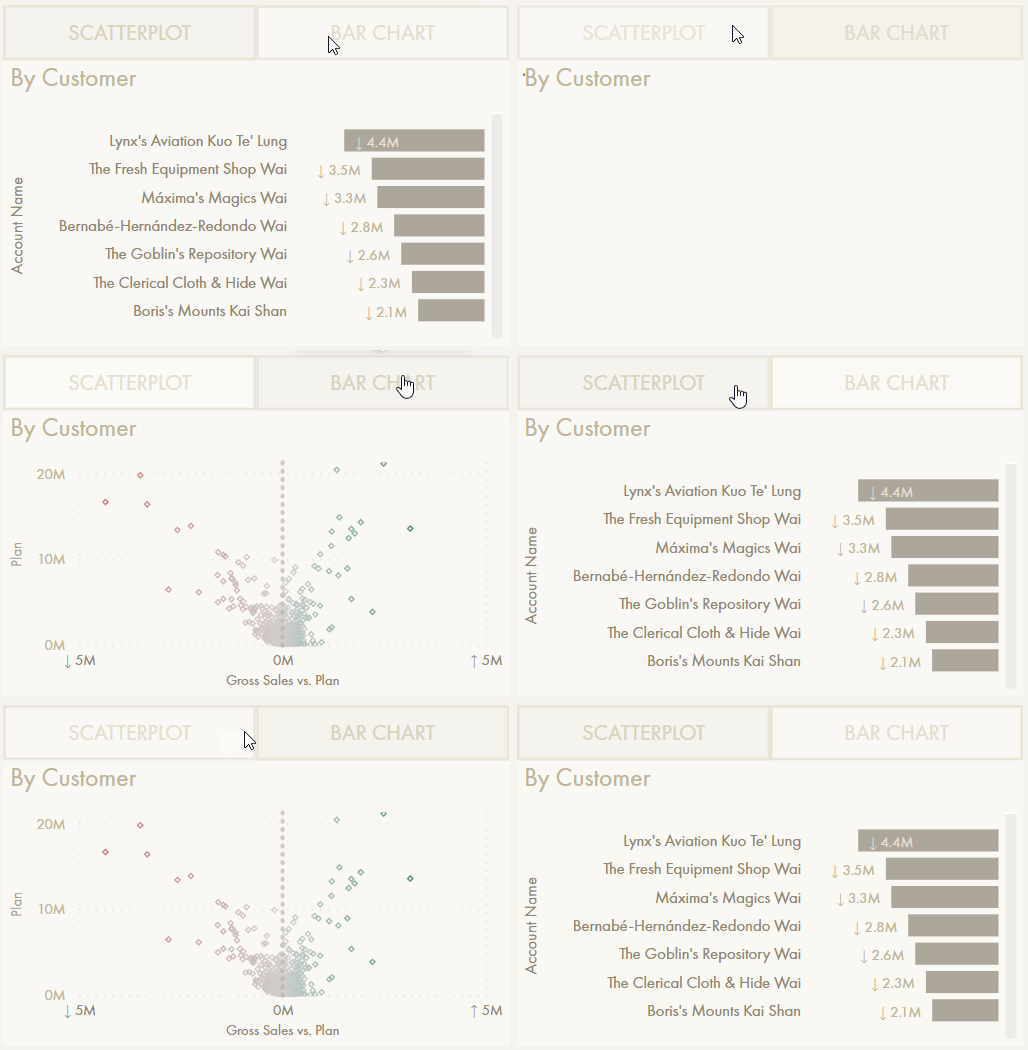
Example where elements are hidden and conditionally revealed with bookmarks + buttons. This would need special attention.
- **Hidden slicers / Visuals:**
Sometimes to get the desired filter context, a report creator might use a slicer with limited interactions (i.e. it is filtering some - not all - of the visuals). Afterwards, the slicer is hidden. Another example is when bookmarks are used to reveal hidden visuals; i.e. switching between chart types (see the example to the right). Documenting these hidden elements is important because it’s not possible for someone to find them on their own.
On a related note, bookmarks in general are important to raise, since maintaining them can be a lot of work if there are significant changes to visuals.
Without proper knowledge transfer, it will be difficult to understand, maintain & change; the report will be dead in the water.
- **Macgyvered visuals:**
Power BI visuals are notorious for being inflexible in very specific ways. There are hundreds of tutorials online showing how to bend the arm of default visuals to show data in a specific way not possible out-of-the-box. Be it for slope charts, dumbbell plots, small multiples in tables, filling areas between lines… there are dozens of use-cases, many that are very common. While it’s good to find solutions to overcome this inflexibility, it undoubtedly makes the report harder to support & hand over. The more customization that is done to a visual, the more time and effort is required for another developer / report creator to understand what was done and how it works. This compounds when there are i.e. measures and calculation groups created just to fulfill a visual requirement.
- **Coded, Custom & AppSource Visuals (Deneb, Charticulator, etc.):**
The ability to make custom visuals in Power BI unlocks total flexibility for those familiar with JavaScript (for D3.js custom visuals) or Vega/Vega Lite libraries (i.e. using Deneb from the AppSource). This is also true for R or Python visuals. However, they undoubtedly exponentially ratchet up the complexity of the report and require special consideration in documentation in handover. Arguably, each custom visual is its own solution entity that requires it’s own documentation, handover, and source control.
---
## REPORT HYGIENE - A CHECKLIST
When designing data models, there are many things you can do to make handover & support easier. Below is an overview of a few points to check during development to ensure a model is ready for handover:

Some of these things are up to personal preference (i.e. having a title page and appendix) but in general they are all worth considering when you’re finishing up a report, or preparing handover.
---

## TO CONCLUDE
**Reports require just as much documentation and handover activities as datasets. If there are a lot of complex or code-heavy visuals, they might even need more.** To avoid wasted time and resources, it’s important to pre-emptively tackle this during development, as was discussed in Parts 1 & 2. For reports, this means creating documentation, particularly for areas that warrant special attention, like visual-level filters or custom visuals. Further, we can follow a checklist of some activities to ensure we have a hygienic, organized report that is easier to maintain.
---
*Special thanks to those who contributed additional items listed in the interactive list, below:*
Sandeep Pawar (@PawarBI)
*(Content not available)*
[**Click here for Sandeep’s twitter**](https://twitter.com/PawarBI)
[**Click here for Sandeep’s blog (one of my favourites)**](https://pawarbi.github.io/blog/)
- Check if Slicer / Filter Pane apply buttons are necessary
- Use modern visual headers
- Check if Personalize Visuals should be enabled and if users are trained to use it
- Set sort on visuals
- Ensure chart axes start at 0
- Check that Text font & font size are consistent
- Check accessibility of colours and fonts (i.e. red-green colourblindness)
- Slicers are synchronized where necessary
---
## POWER BI REPORT
Multi-page, interactive report connected to an underlying dataset. Enables end-users to view, explore and act on data visually presented to them.
### Layout & Design
### Accessibility
### Testing and Performance
### User Experience (UX)
### Report Handover
### Report Documentation
### Report Business Users Training

 - **Visual-level filters:**
Too often, time is spent troubleshooting an “incorrect” visual when it’s eventually discovered that the problem was a visual-level filter no one noticed or everyone forgot. There is nowhere in the report which will draw your attention to these; they only appear when selecting the visual. It’s thus important to raise them explicitly in documentation, i.e. in a table of “visual-level filters”.