# “It Depends” - Power BI Best Practices & Optimizations
> We look at the difference between best practices and optimizations. We also define a four-step method to tackle complex issues with dataset/report performance and design.
- URL: https://data-goblins.com/it-depends
- Author: Kurt Buhler
- Published: 2023-02-28
- Topic: Semantic models
---
# HOW TO DEAL WITH COMPLEX PROBLEMS
*…and the importance of **critical thinking & evidence-based testing** when optimizing Power BI.*
---
*No time to read a long-form article? That’s fine! This article has an audio version that you can listen to in the background while doing other things. Goblin drawings & cartoons are only in the article, though!*
![audio-thumbnail]()
It Depends
0:00
/0:00
---
## THE GOLDEN RULE OF “IT DEPENDS”
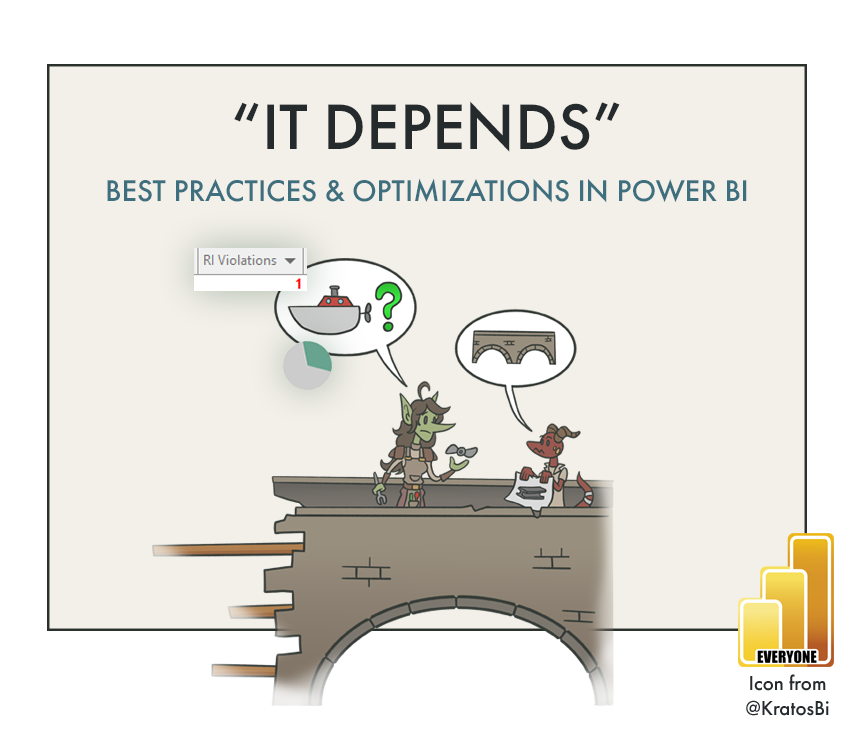
How do I cross the river? What’s best? ”Well… it depends…”
> *”Don’t break query folding in Power Query.*”
*”Remove blanks caused by Referential Integrity violations in model relationships.”*
*”Don’t use table filters in CALCULATE.”*
*”Don’t use Pie Charts in Reports.” *
*”Distribute from Apps and not Workspaces.”*
**These are some of the mantras repeated in Power BI circles and content.** They are examples of *best practices *or *optimization techniques*: things that may result in a better solution when followed. However, each of these exist across a spectrum of how often they apply, and what the measurable impact is on the final solution. **The truth is that while they might *generally *apply to many cases, they don’t *always *apply to *every* case. ***It depends* on the data, the model, or even the users and use-case. So what does it mean for your solution to follow best practices, and should it? How can we successfully optimize the things we’ve made in Power BI?
**This article explains the difference between a best practice and optimization techniques, and how to apply them to your Power BI solution.** We’ll discuss the dangers of treating an optimization as a best practice, and share an approach to tackle complex problems, illustrating with examples how optimizations should be applied to a Power BI dataset or report.
---
# BEST PRACTICES & OPTIMIZATIONS
[**I. INTRODUCTION:** BEST PRACTICES & OPTIMIZATIONS](https://data-goblins.com/it-depends)
[** II. PERFORMANCE: **TESTING,REPLICATES & RELEVANCE](https://data-goblins.com/it-depends)
[**III. DATA VISUALIZATION:** TIME-TO-INSIGHT & SUBJECTIVE PREFERENCE](https://data-goblins.com/it-depends)
---
---
### WHAT IS A BEST PRACTICE AND WHY IS IT HELPFUL?
**Best practices are methods to address a problem, recognized as superior to alternative approaches.** This might be something technical, like a DAX or M pattern to solve a particular business requirement, but could also relate to people or processes. Examples here are distributing reports, organizing & documenting datasets, or gathering requirements.
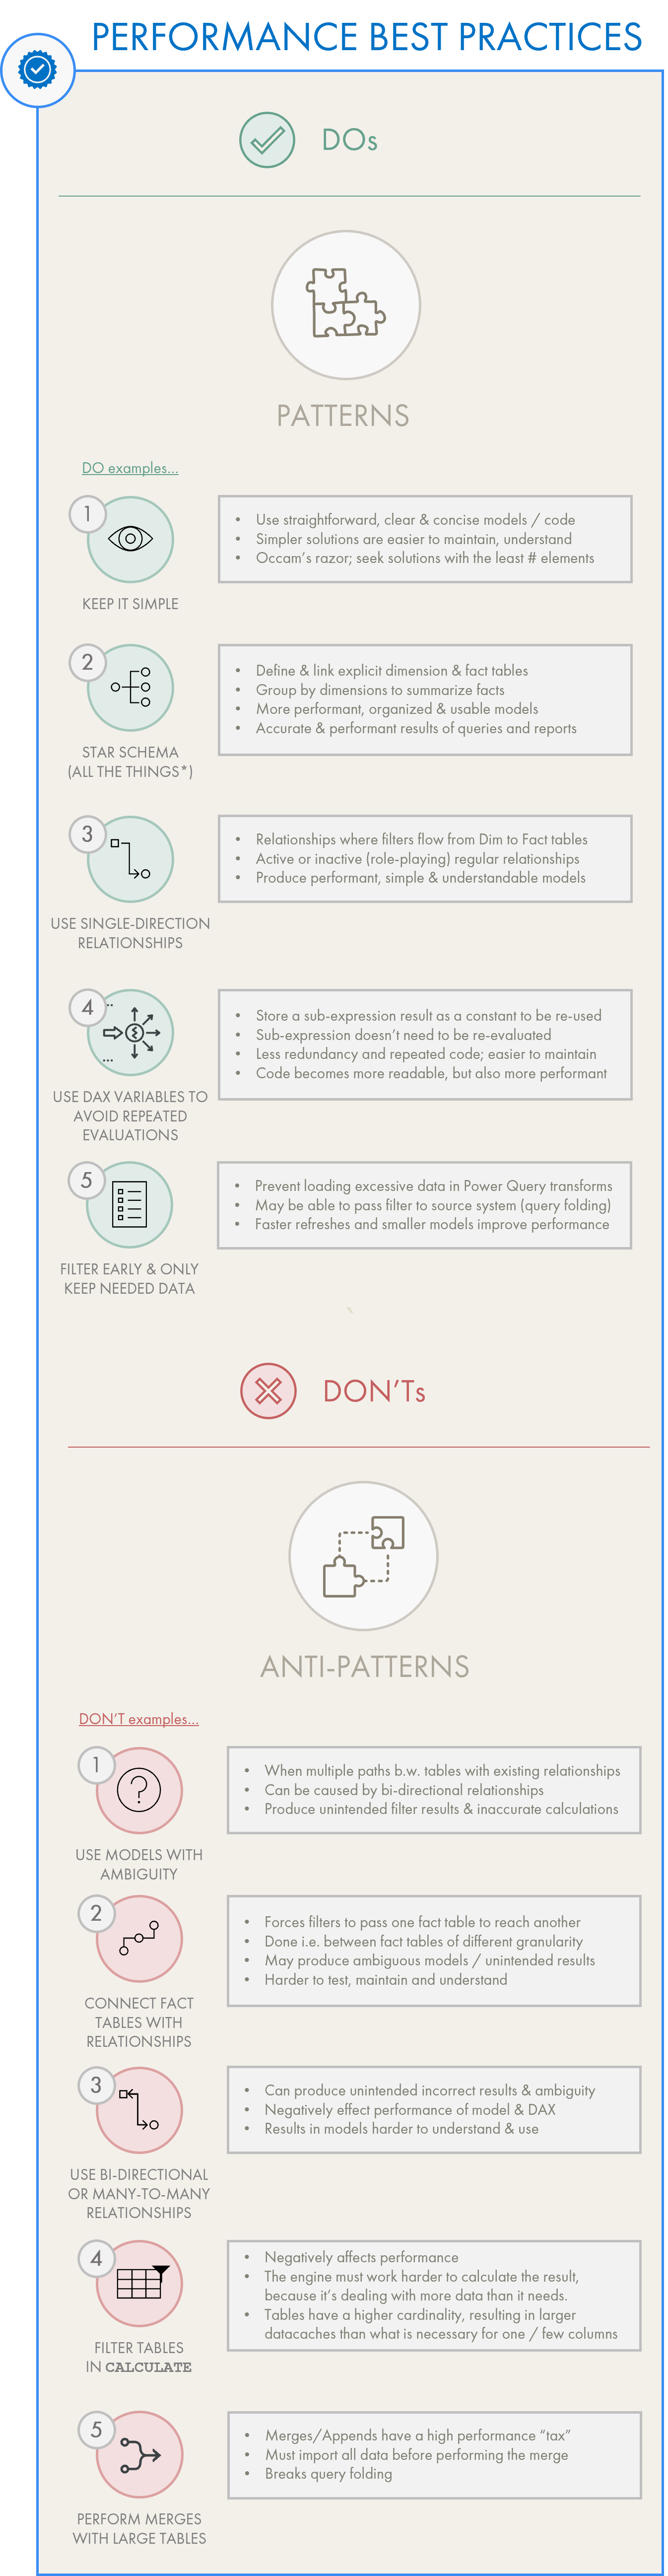
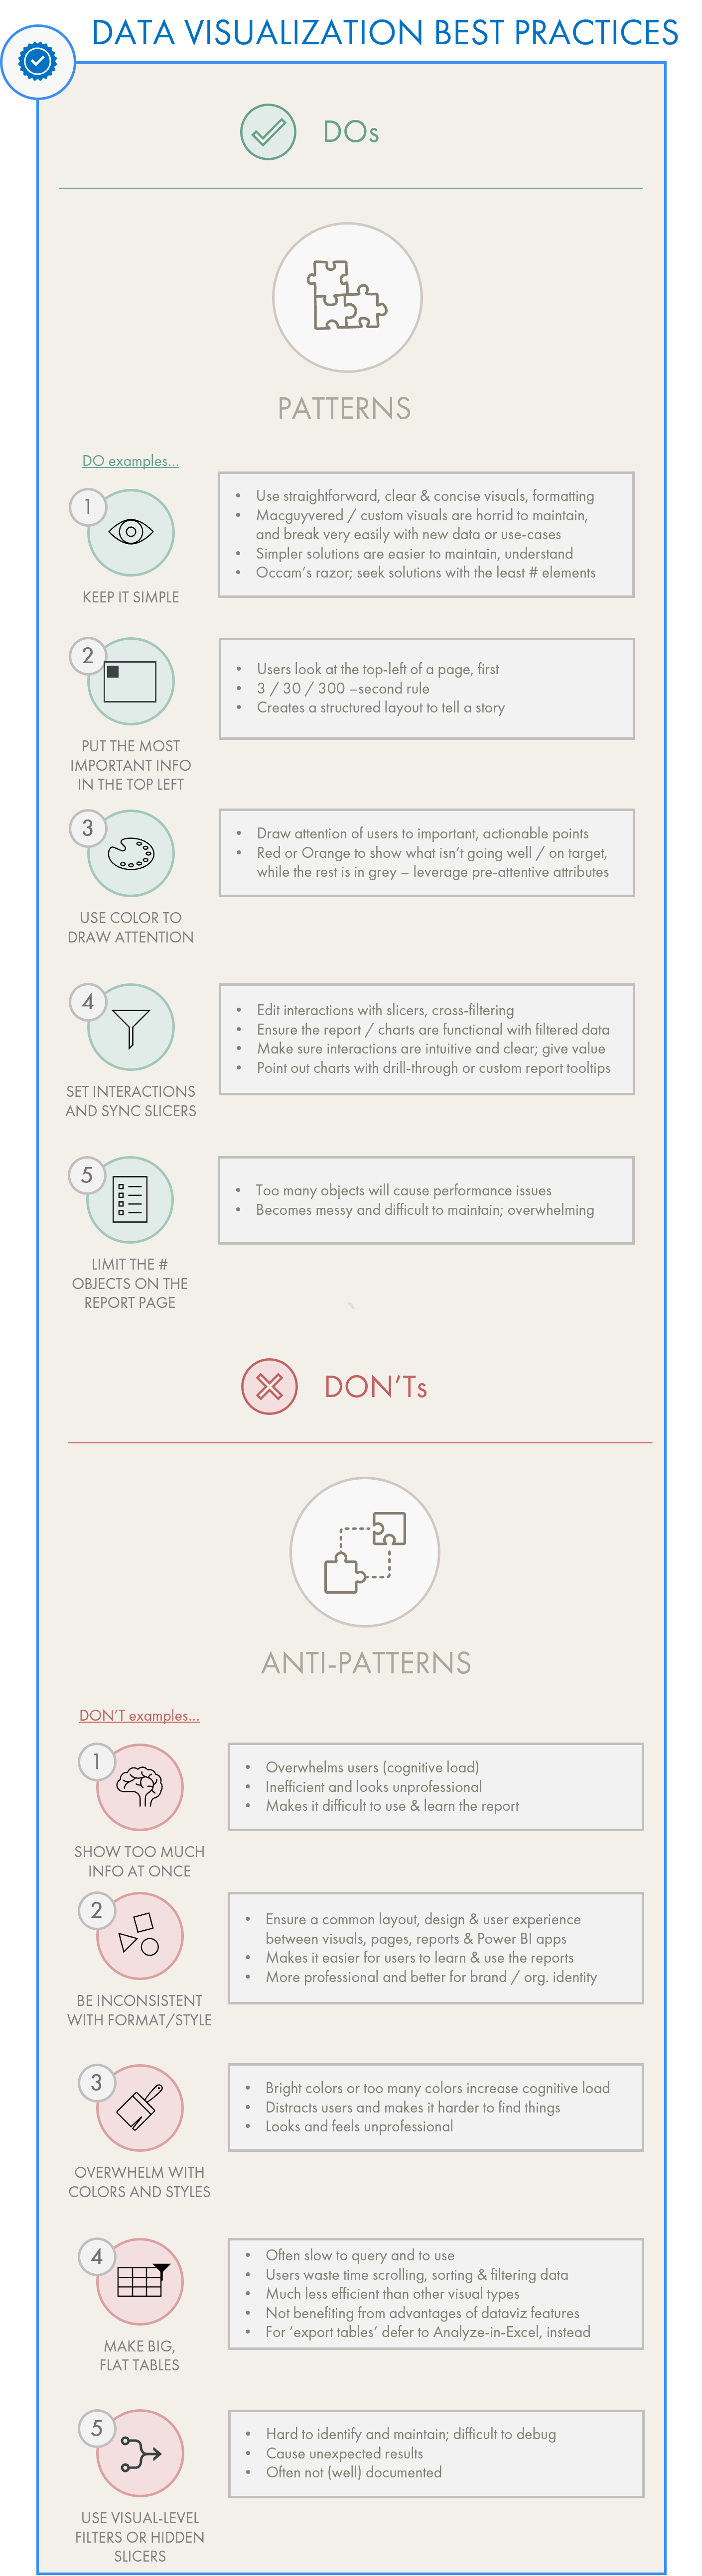
**Best practices typically come in two flavors: DOs (patterns) & DON’Ts (anti-patterns).** They are valuable as they provide ‘default’ options fitting a wide range of scenarios. *Some examples are listed below:*
---
Best Practices usually are expressed as actions; things we should do or should not do. Examples above. * ”Star Schema All the Things” - Koen Verbeeck
---
**Best practices help us make better Power BI solutions.** Because they apply to many cases, they are usually well-understood. As such, they are easy to learn, repeat and teach; paths through the unknown and ‘rules’ for navigation in a wilderness of complexity. When collected, such best practices form the basis of helpful resources like books, documentation or checklists. This is valuable as it communicates a common standard for tools, processes & problems. This standard provides what we *should* do, and *how* we should do it. *However, is this always true?*
Best practices provide valuable default options, but are not obligatory for every situation. Some requirements or problems might require a departure from best practices.** It is important to clarify that this can be dangerous unless handled by an experienced developer.** Deviating from these best practices can produce unintended effects which a novice may not identify or understand, particularly in pursuit of optimization.
**While implementing best practices in a solution can optimize the result, not every optimization is a best practice.** There is a distinct difference between a ***best practice** *and an ***optimization technique.*** Understanding this and how to apply optimizations is essential to make quality Power BI content.
---
### WHAT ARE OPTIMIZATIONS? HOW DO THEY DIFFER FROM BEST PRACTICES?
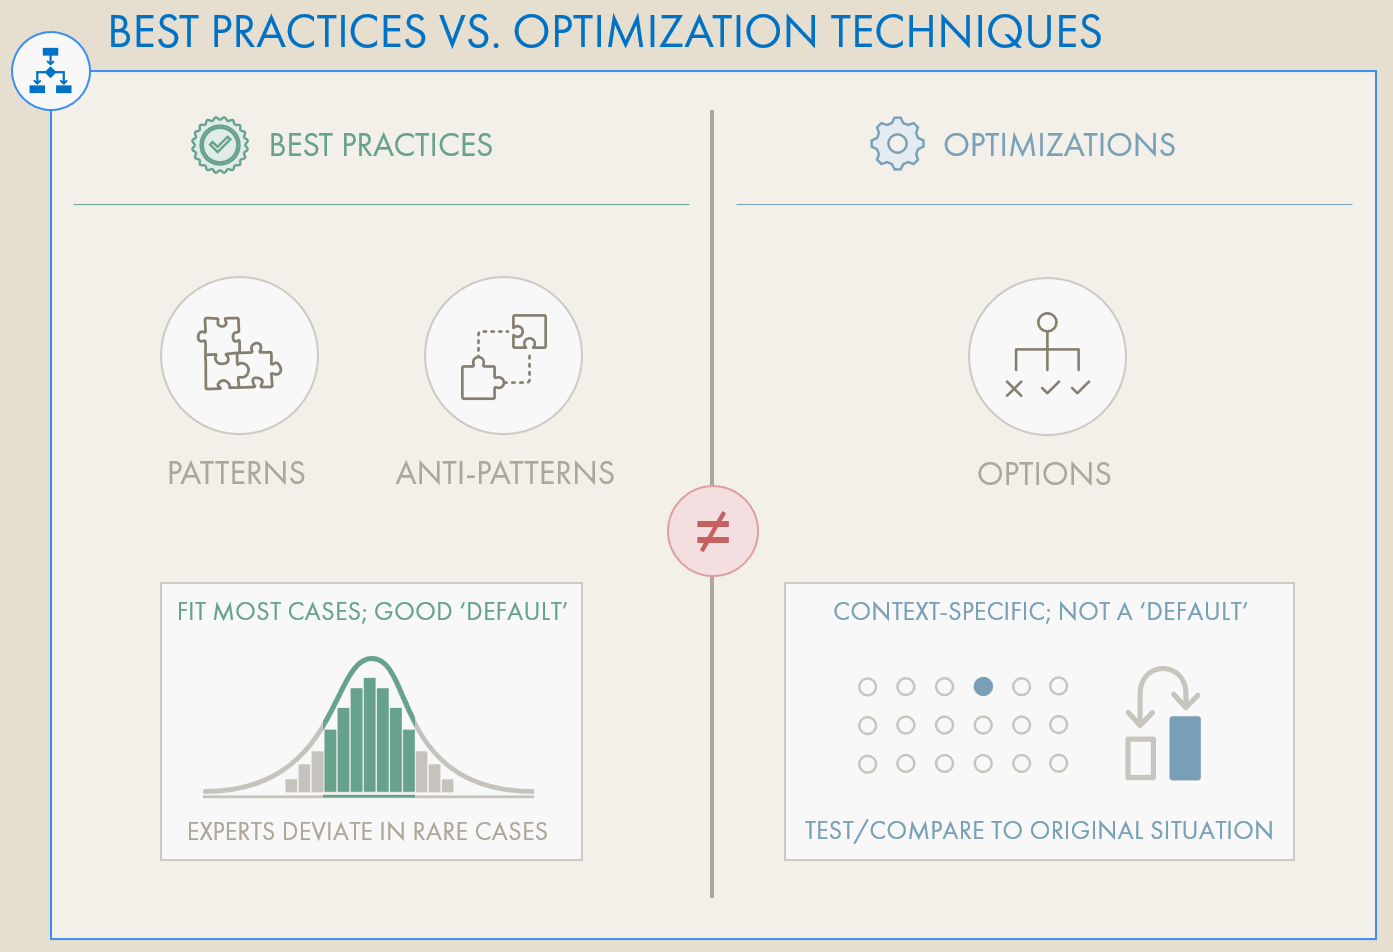
**An optimization technique is a specific adjustment or addition to a solution that can improve it in a measurable, objective way.** Unlike best practices, optimization techniques must not be considered as default options or standards. Where there is *one* *default best practice* for a particular problem, there are *many possible optimizations*, none of which are guaranteed to actually optimize the solution in question. **In fact, optimizations typically add complexity to an approach or solution, or may even contradict an existing best practice, altogether.** Optimization techniques are situational, they must be deeply understood and tested *before* being applied. There are typically more nuances & elements to consider than when applying a best practice.
---
A technique to optimize a model or report is not a default option or best practice. It is an option which may or may not have an effect depending on the context; the data, model, calculation, use-case & users.
---
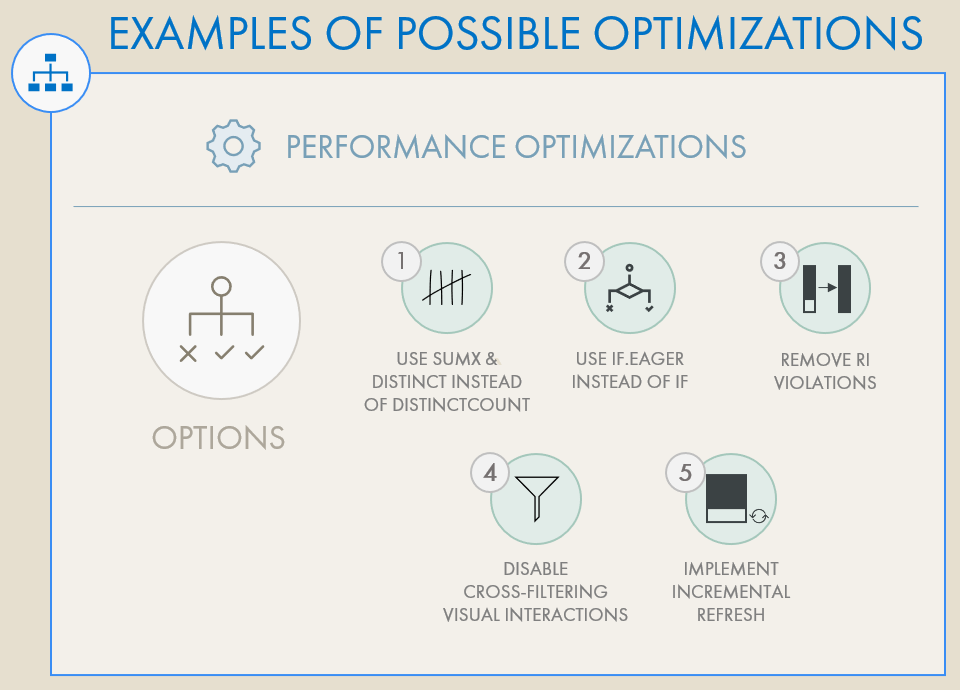
Examples of optimizations to improve performance of a model or report.
---
---
**A common mistake is to assume that an optimization — which works in one or two situations — can be broadly applied; to evangelize the optimization as a best practice.** This is an easy mistake to make, particularly as we work with the same data, models & business problems for a longer period-of-time and become less aware of our own preferences, biases and assumptions.
---
We may insist on certain tools or approaches because in one or two instances they were faster or better. “ It is a best practice to use a boat to cross water. We can optimize the boat speed with this motor.”
---
**Learning about optimizations is helpful, because they provide concrete, actionable possible answers for problems.** *Put the square block in the square slot.* Reality, however, is inconvenient; In the real world, no block is square, and it might go through many slots, while none of them may be a perfect fit.
**The difficult truth is that many problems are both diverse and context-sensitive; they have nuance that might bend or even outright defy even a known ‘rule’ or ‘best practice’.** This can result in optimizations being applied to a situation where it might seem like it fits, but it doesn’t help the problem. It might even make the problem worse; either because it doesn’t fit the data, the use-case, or the users, themselves.
---
Certain optimizations - even best practices - may not fit a particular solution, the data, or the users. “The water’s too shallow, the current’s too strong and I don’t know how to drive a motorboat! ”
---
### CHALLENGES OF BEST PRACTICES & OPTIMIZATIONS FOR SOLUTION DESIGN
**Best practices are only helpful when applied to the appropriate tool, process or problem.** Some practices become inherited by developers across different generations of conceptually similar tools… usually by habit, even without sufficient evidence. This is commonly seen when assumptions are made that Power BI should be used like another, previous tool or technology. For example, best practices of a relational database (limit string length, use integer instead of string keys) don’t apply to a Power BI dataset / Tabular model. This *dogmatic *behavior can be dangerous, producing solutions designed in pursuit of rules that do not necessarily apply.
**Similarly, optimization techniques over-extrapolated as best practices are also hazardous.** They may result in unnecessary complexity, producing a solution more difficult to understand and maintain, or even result in unintended or even opposite effects as what was desired.
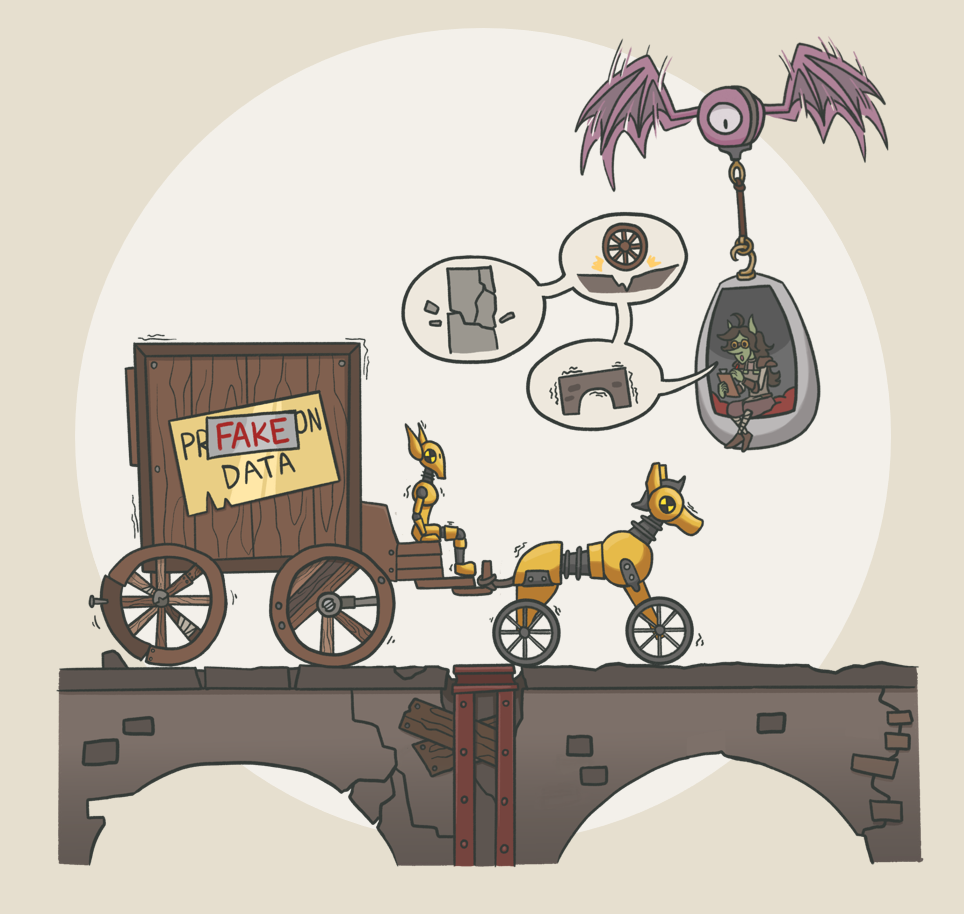
**The consequence of these may be a Power BI solution that doesn’t fit the business problem or context.** In this situation we are destined for disaster,driven on a road paved by good intentions.
---
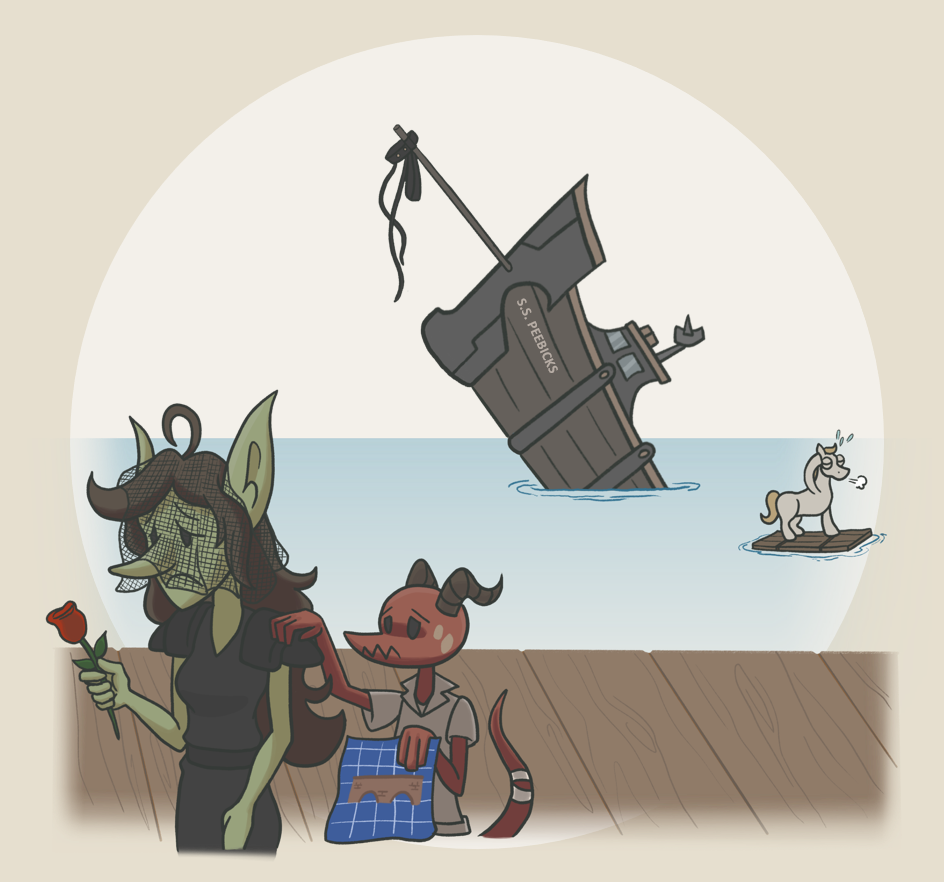
We may reject alternative solutions because of personal preference or bias to our own experience, clouding our judgement and preventing us from assessing the full context of the problem space. “ Why can’t we just use the boat? Motorboats are faster than bridges, after all, and boats are a best practice!”
---
### CHALLENGES FOR LEARNING & TEACHING
**People want clear answers to their problems. Nuance is frustrating, and “it depends” doesn’t feel like a ‘real’ answer (even if it’s true).** For this reason, it’s difficult to learn how to tackle complex problems & optimizations in Power BI. It is tempting to extrapolate an experience; **rules are easier to memorize than concepts are to dissect and understand.**
Most people want to know what they should do and what is best. Instead, they are confronted with conflicting or ambiguous information, not knowing what is “correct”. Further, instructors and content creators can struggle to present a clear, understandable message while still conveying the nuances of the topic. Presenting a complete and accurate picture of a topic requires deeper and more complex knowledge, thus more time/effort to create that material and greater risk that less people read and understand it (since they want a simple answer).
*So what to do? How can we learn to deal with complex Power BI challenges and optimizations?*
---
It’s tempting to over-extrapolate our own experiences when confronted with new, complex problems. “They use these horses a lot. Maybe if the boat has a horse it will cross the river? ”
---
### MITIGATING THESE CHALLENGES; DEALING WITH COMPLEX PROBLEMS
**To improve the way we tackle complex problems and optimizations, we need an evidence-based approach.** This means we must focus less on trying to memorize rules and patterns, and more on how to gather, understand and test the available options, selecting & justifying one where we see the best effect. We should not implement any optimizations or changes if there are no evidence for improvement, even if it is an option we may prefer.
*In the next sections, we’ll discuss a concrete approach to do this for both performance issues and selecting the right chart types for report visualizations.*
---
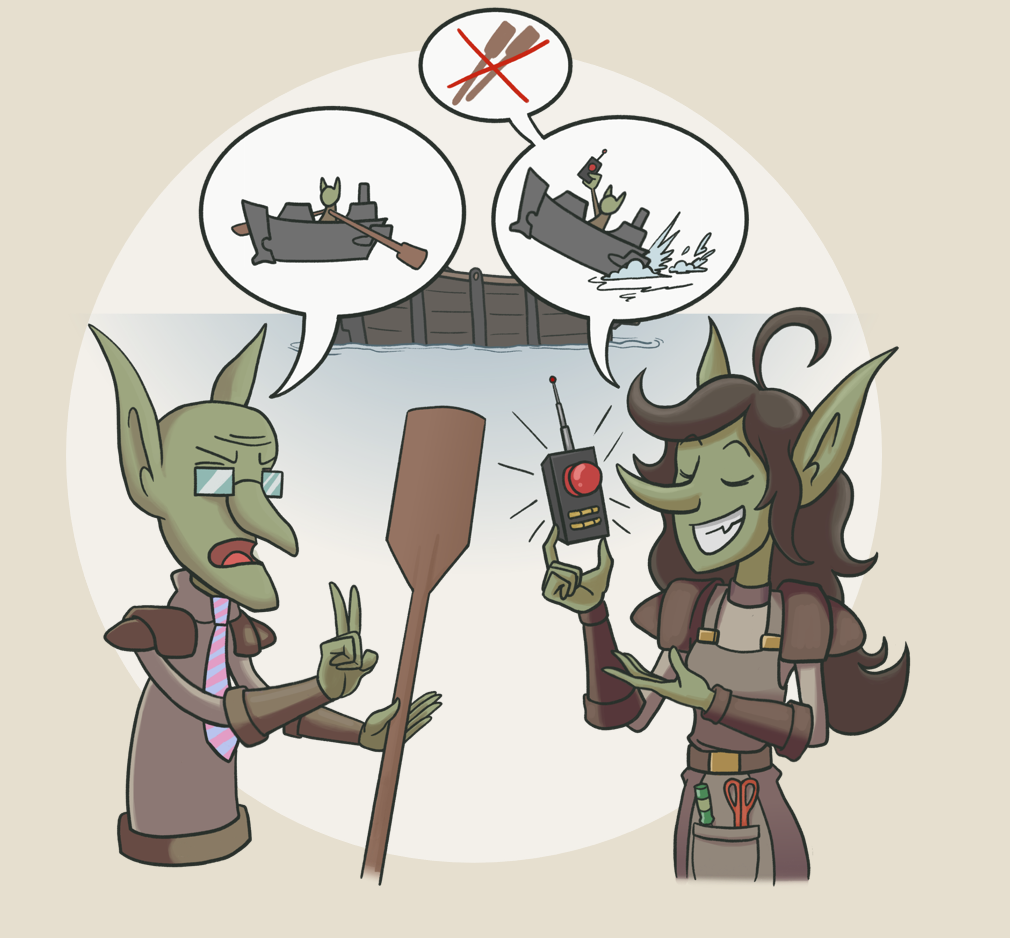
There are more ways to cross a river than only a boat; be aware of the context & understand the options. “ You may be a boat-maker who makes good boats, but this particular river needs a bridge.”
---
**Performance issues are common pain points in a Power BI solution.** Finding and resolving bottlenecks in report or dataset refresh speed can be an arduous, painful exercise that costs a lot of time. Thus, a lot of information caters to these problems, presenting possible optimizations to resolve performance issues in models & reports.
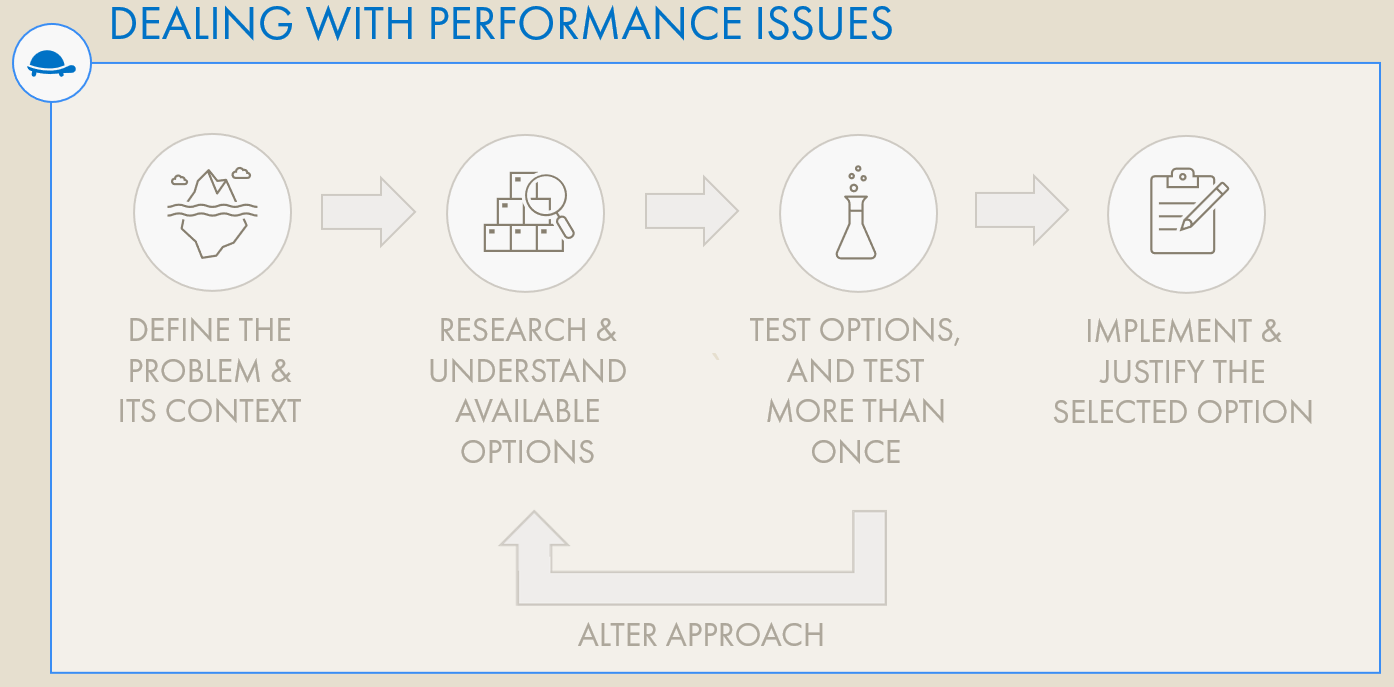
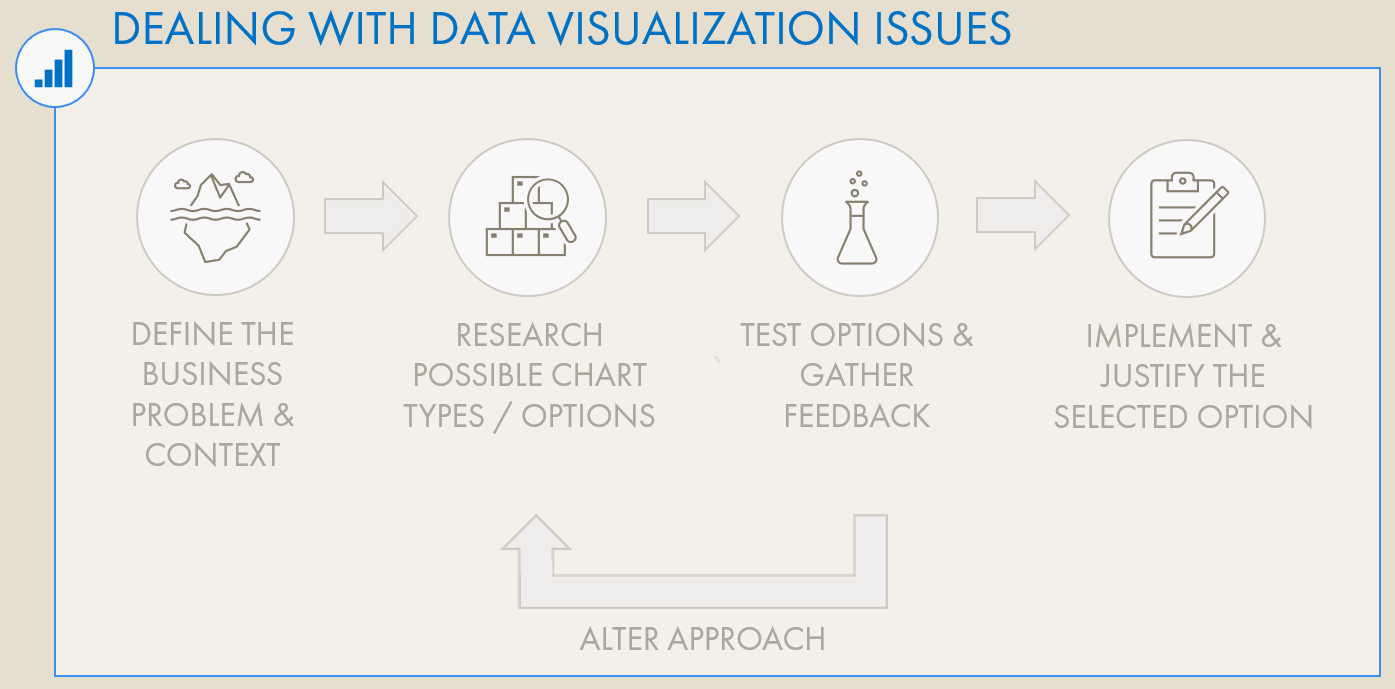
When confronted with performance challenges and our solution is already adhering to best practices, we can take a 4-step, evidence-based approach to find & test possible optimizations, outlined below:
An 4-step, evidence-based approach for performance optimization
### STEP 1: DEFINE THE PROBLEM AND ITS CONTEXT
**When performance becomes a concern, it’s first important to define the context and the (potential) impact.** It helps to take a step back and clearly answer some questions, like:
- *What is the objective, here? What is this calculation or query trying to do?*
- *What problem are we trying to solve with this query / expression / visual?*
- *Where and how would we get performance issues? Can they prevent us from reaching our objective?*
- *What part of this context can we control or change?*
- *What part of this context do we have no influence over? Why are we powerless to change it?*
- *What would happen if we do nothing? If we stick with the plan?*
The goal is to identify what the solution should do that the performance issues are preventing, and where in the solution we should look for bottlenecks. Defining the context makes sure we know what the ultimate goal is, and we don’t get distracted by technical details.
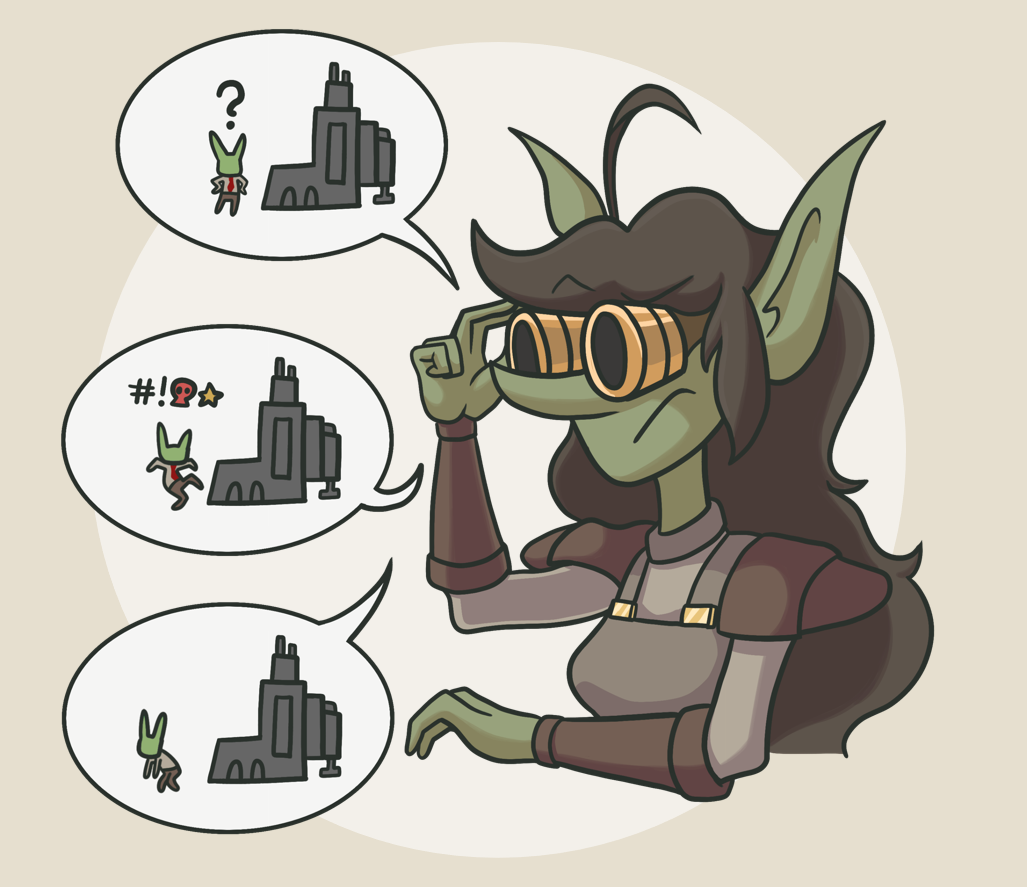
The query to that DirectQuery table might be slow, but is the objective to have a fast query? No, probably not. The objective is to show *Sales MTD*, to count *Number of Returning Customers *by region, and so on — to address the business requirement, and to do it in a performant manner. Don’t lose sight of the bottom line.
### STEP 2: UNDERSTAND THE AVAILABLE OPTIONS OR APPROACHES
**Once we identify the objective and bottleneck, we must find & understand our options to optimize it.** This is already a difficult challenge; we will not have a library of patterns from which we can make a selection. Instead, we need to research and experiment with the identified bottleneck. In many cases, this may require reading or re-visiting theoretical or instructional documentation (such as from [learn.microsoft.com](https://learn.microsoft.com/en-us/training/powerplatform/power-bi), [sqlbi](https://www.sqlbi.com), and [other trustworthy sources](https://blog.crossjoin.co.uk)) to better understand how the bottleneck is occurring and what we might do about it.
**This usually results in a list of possible options; different approaches, adjustments, or full patterns to address the problem.** It’s not sufficient to simply gather these options, however. It’s important to understand how they work and what effect they might have. Why are they possible solutions; how can help us reach our objective? This is obviously a lot more work, but will lead to a better understanding of the problem and thus why the eventual solution is a good fit.
### STEP 3: TEST, AND TEST MORE THAN ONCE
Test the options before implementing them. Ensure you design & execute reliable tests.
**Once we’ve identified the options, we can test them in our model to see if they have an effect.** To do this, we need to design proper tests to gather meaningful metrics that will help us *objectively* identify if we’ve improved the situation. The first thing we need is a tool to measure the performance. Below are those commonly used:
- **Power Query Performance:** SSMS Profiler ([Seamark Method](https://dax.tips/2021/02/15/visualise-your-power-bi-refresh/)); REST APIs (Refresh History)
- **DAX Performance:** DAX Studio (Benchmarking Tool)
- **Report Performance:** Power BI Desktop Performance Analyzer; DAX Studio (Benchmarking Tool; Visual queries copied from the performance analyzer)
Next, we need to measure the performance before and after trying different changes, and compare the result. To conduct good tests, it’s recommended you do the below:
- **Measure a model in the Power BI Service (remote model), if you can:**
Measuring on a local machine introduces the effects of your hardware and isn’t representative of what is happening in the Power BI service. Measuring performance in the Power BI service will help you get more relevant results.
- **Measure more than once and compare the average; definitely 3+ times and ideally 10+ times.**
The same queries and dataset refreshes can be highly variable depending on uncontrolled variables such as time-of-day, network latency and so on. If you compare results after a single measurement, any difference is likely to be due to random chance and not representative of a real effect.
- **Ensure conditions are controlled when comparing before & after your changes:**
Measure on similar days at similar times, and try to control for things like model data, usage and other impactful changes to the model or reports between tests.
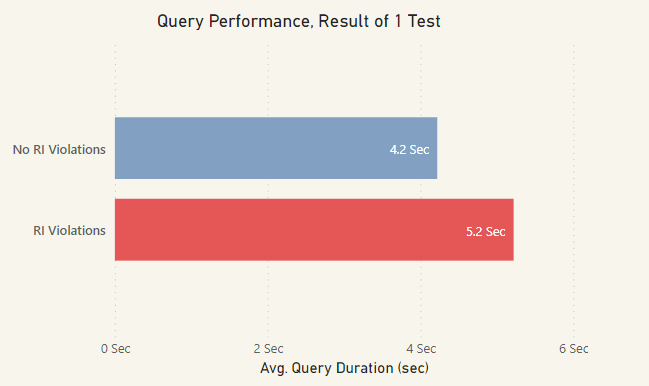
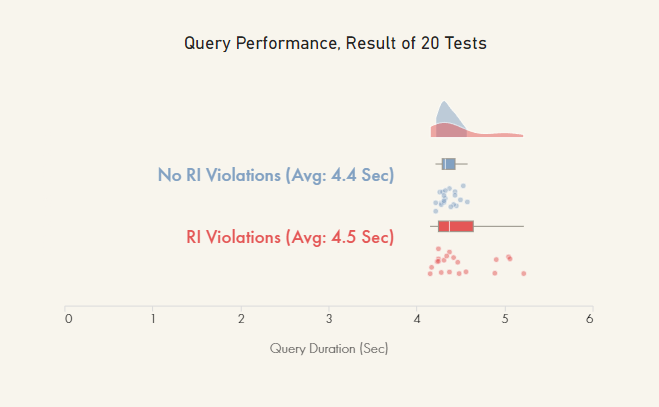
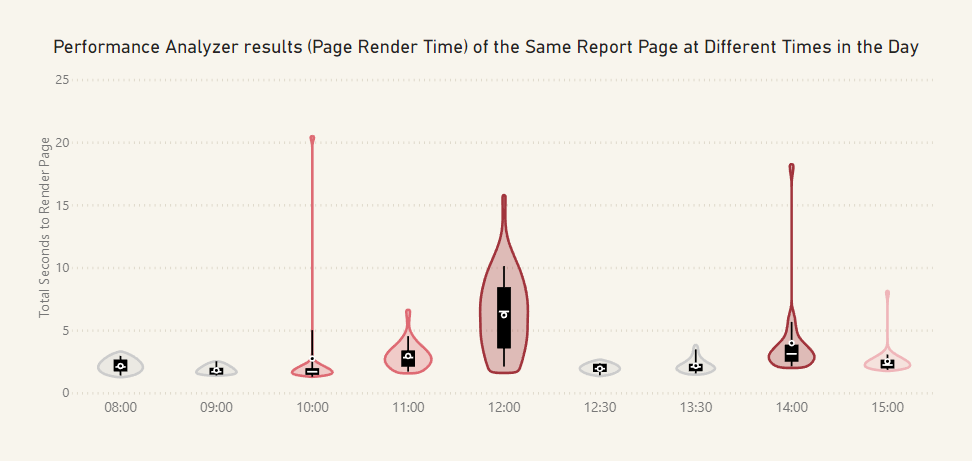
*Below are examples of why testing only once, or testing across uncontrolled conditions can result in **misleading** or **outright incorrect** conclusions, resulting in the wrong optimization being used. These are real data from real examples of production data models tested:*
---
When testing once, it looks like RI Violations are negatively impacting the query performance on the particular model & query being tested.
---
Testing 20 times using DAX Studio’s “Benchmarking” feature reveals the effect was due to random chance; there is no significant difference in performance for this query & model with vs. without RI Violations; removing RI violations is not an effective optimization for this particular model / query. This chart was made by adapting the Raincloud Labelled Deneb template from Kerry Kolosko
---
Depending on when & how you test, you will get different results. In the above graph, a poorly-performing report page was tested with the ‘Performance Analyzer’ in Power BI Desktop at different times in the day, without any changes to the report or model. Dramatically different results are observed at different times, perhaps due to activity on the dataset and dedicated capacity, but could also be due to transient effects from a local network or VPN. This graph is a Violin Plot custom visual by Daniel Marsh-Patrick which shows well the variation in tests
---
Challenge dogmas and assumptions. It’s often assumed that using integers for fields and keys will result in better performance, despite evidence already showing it does not , because it’s a best practice in relational modelling. In the above, we see no significant improvements in query time when changing the data type of fields used in the relationship. This chart was made by adapting the Raincloud Labelled Deneb template from Kerry Kolosko
---
An example of an optimization test with two options tested vs. original, 10 times each. The original - a MTD Sales vs. Target visual - relied on a SWITCH() statement to dynamically select the target. Using a different approach with calculation groups (V3) resulted in average query times 10x faster than the original, so they were implemented in the model. This graph is a Violin Plot custom visual by Daniel Marsh-Patrick which shows well the variation in tests
---
### STEP 4: IMPLEMENT & JUSTIFY THE OPTION; OR REJECT IT AND MOVE ON
**If done correctly, the performance testing should provide evidence for one of the options or changes as having the best effect.** Alternatively, they may reveal that none of the options produce the desired result; that there’s no significant difference between the proposed optimization and the original solution.
If this is the case, it’s important to revert to the original, as there’s no evidence to justify the change. The original solution is also usually simpler, too.
---
Following an evidence-based approach provides a structured and objective method to understand and optimize performance issues in a Power BI solution. While it takes more time and effort, it will help you better understand the problem, learn the possible optimizations, and justify the selected approach.
*This approach is clear for quantitative problems like slow reports, but what about report design? Can this approach be applied to help us design reports with complex requirements, too?*
Despite being a different, more subjective area, the process is the same to address complex problems.
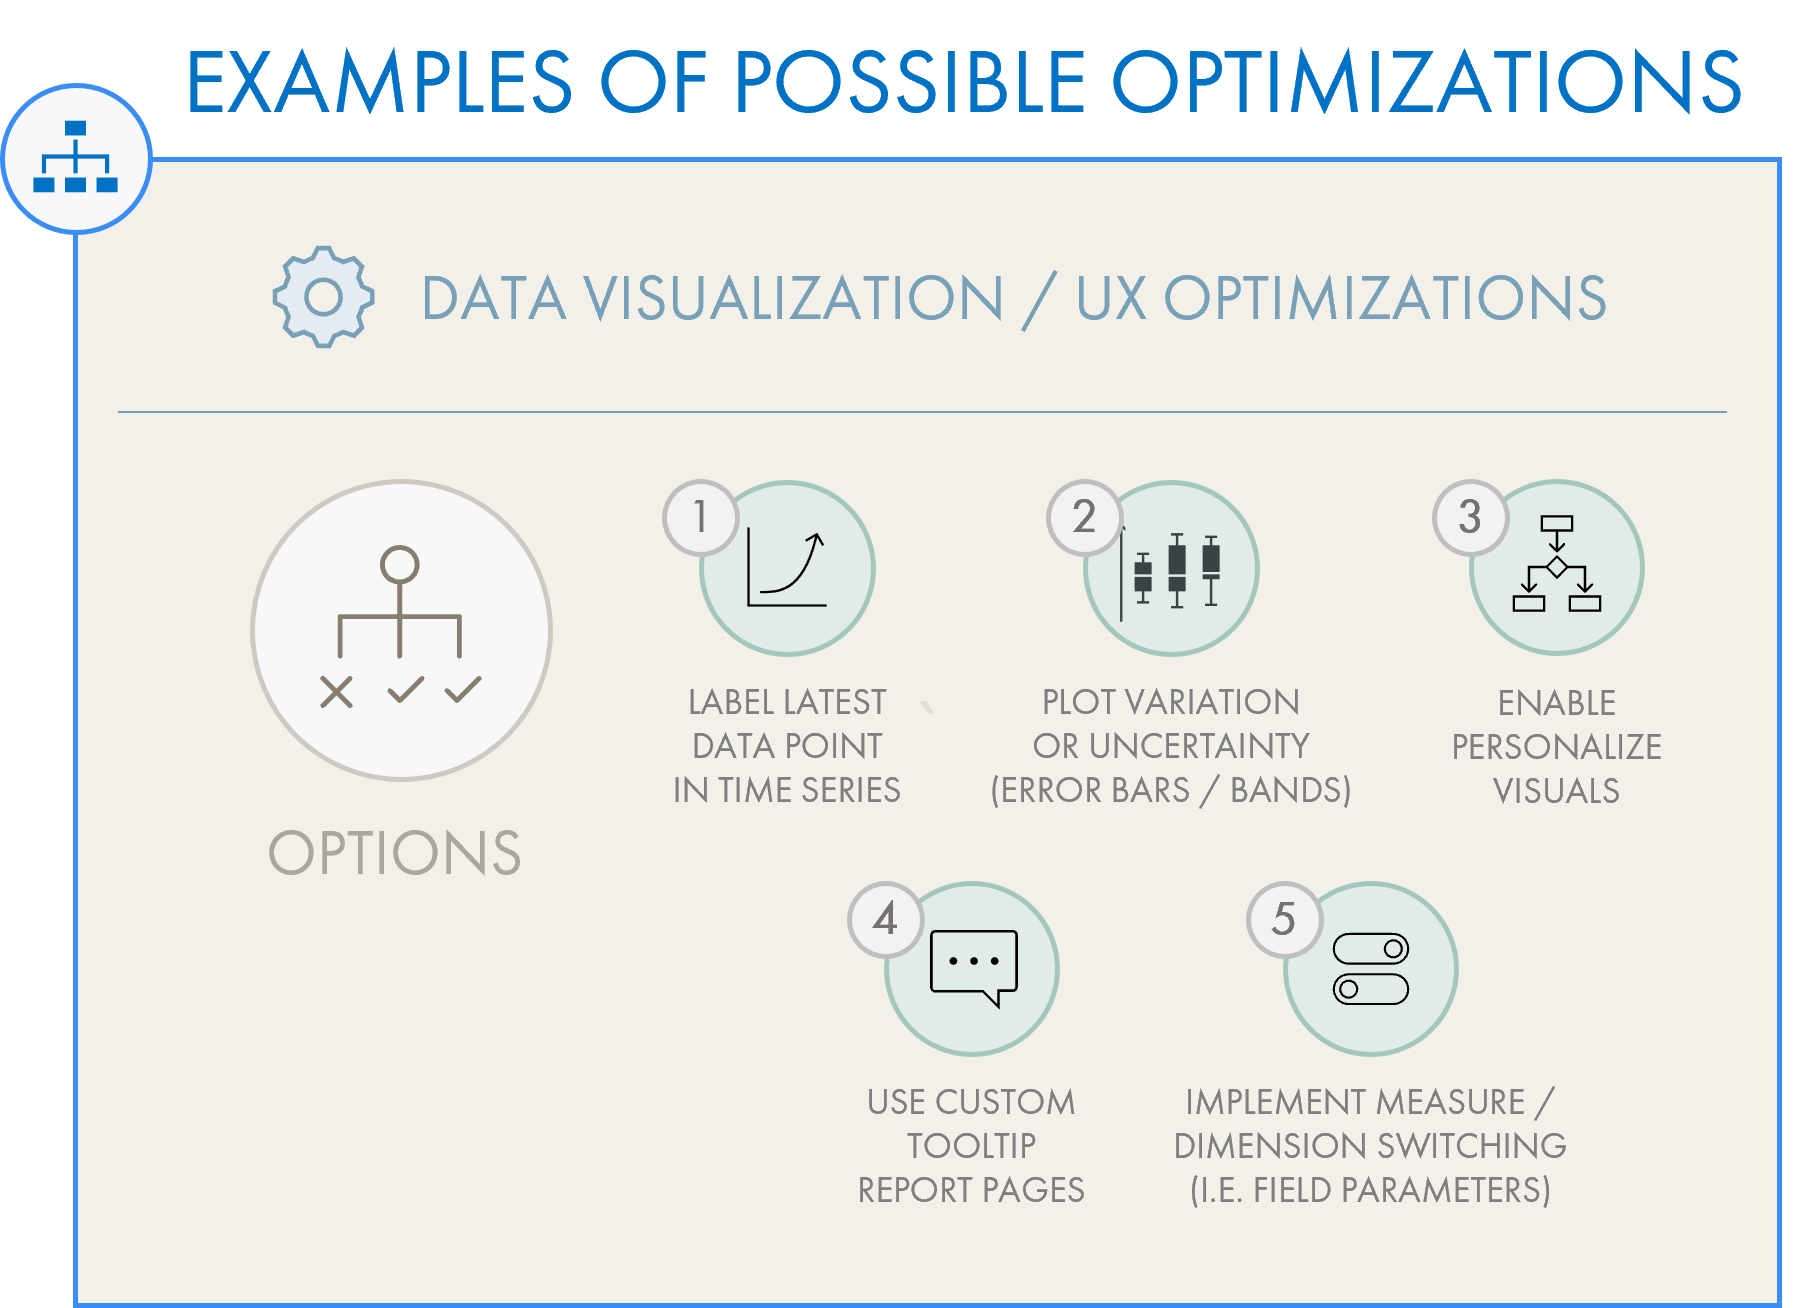
**While model and report performance is an objective, quantitative problem, data visualization and governance appear — at first glance — to be subjective or even vague.** [There do exist many data visualization best practices](https://youtu.be/V8vGoxx2q0Q), which aim to provide guidelines for more reliable, accessible and elegant visuals in reports and dashboards. One commonly repeated is to avoid Pie & Doughnut Charts. This has become more than a meme than a best practice; there do exist use-cases where a Pie or Doughnut Chart could be valuable in an analysis.
**Below are examples of DOs and DONTs in data visualization; patterns and anti-patterns:**
---
Examples of best practices for Power BI reports.
---
Examples of optimizations to improve the user experience or efficiency of a Power BI report.
---
*Interested in learning more about Dataviz best practices? I have a 1-hour talk about it, here:*
---
---
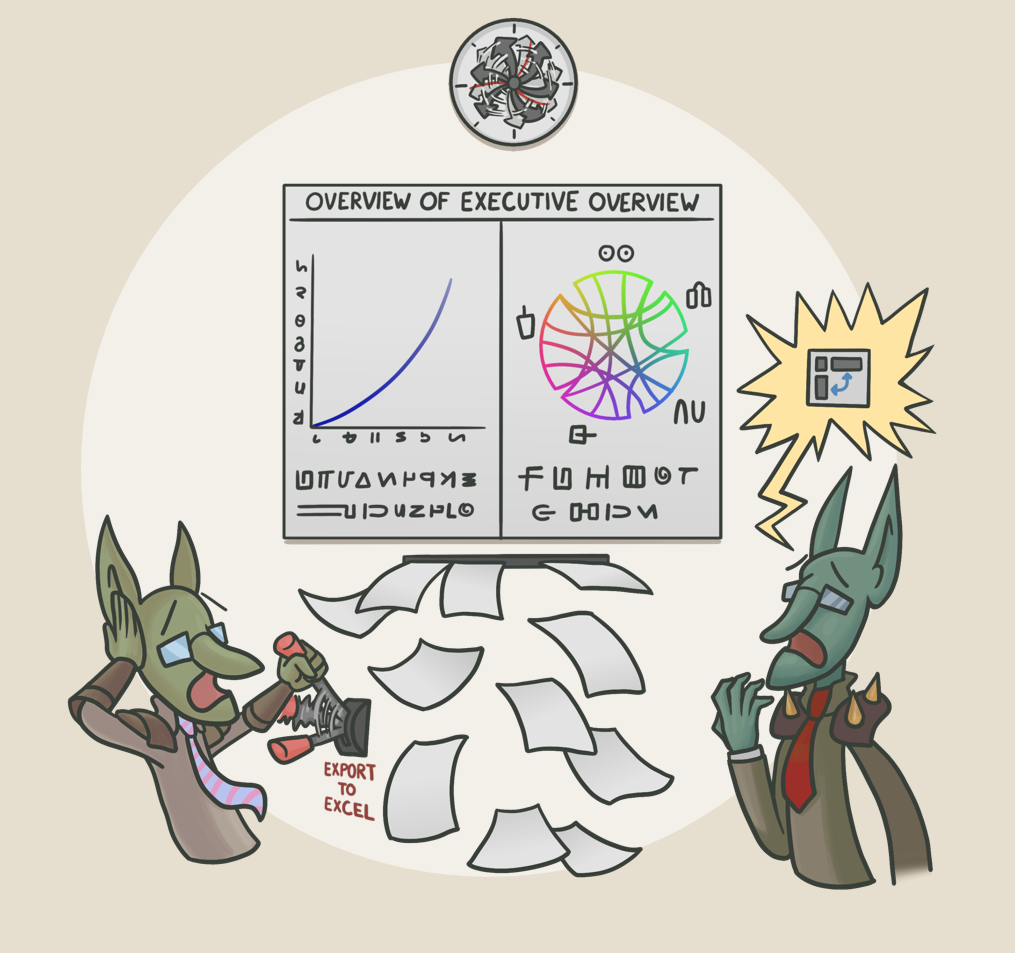
Designing a good report is about more than memorizing & applying data visualization ‘rules’. In fact, we can take a similar evidence-based approach to support the design of reports for complex business requirements or data.
### STEP 1: DEFINE THE PROBLEM & ITS CONTEXT: USERS & BUSINESS PROBLEMS
During the requirements-gathering process, we should aim to get a sufficient understanding of the problem and its context. **Here the context is all about the users and the particular business problem they are trying to address in the report.**
- *What question are we trying to answer?*
- *What will we do with the data?*
- *How will it help us answer this problem?*
- *How will we use this visual; how will we interact with it? Do we expect to use drill-through, drill-down or other, more advanced actions?*
- *What solutions are we using today to answer this question (visuals, reports, or other things) and why do they / don’t they work?*
### STEP 2: UNDERSTAND THE AVAILABLE OPTIONS: CHART TYPES & FORMATTING
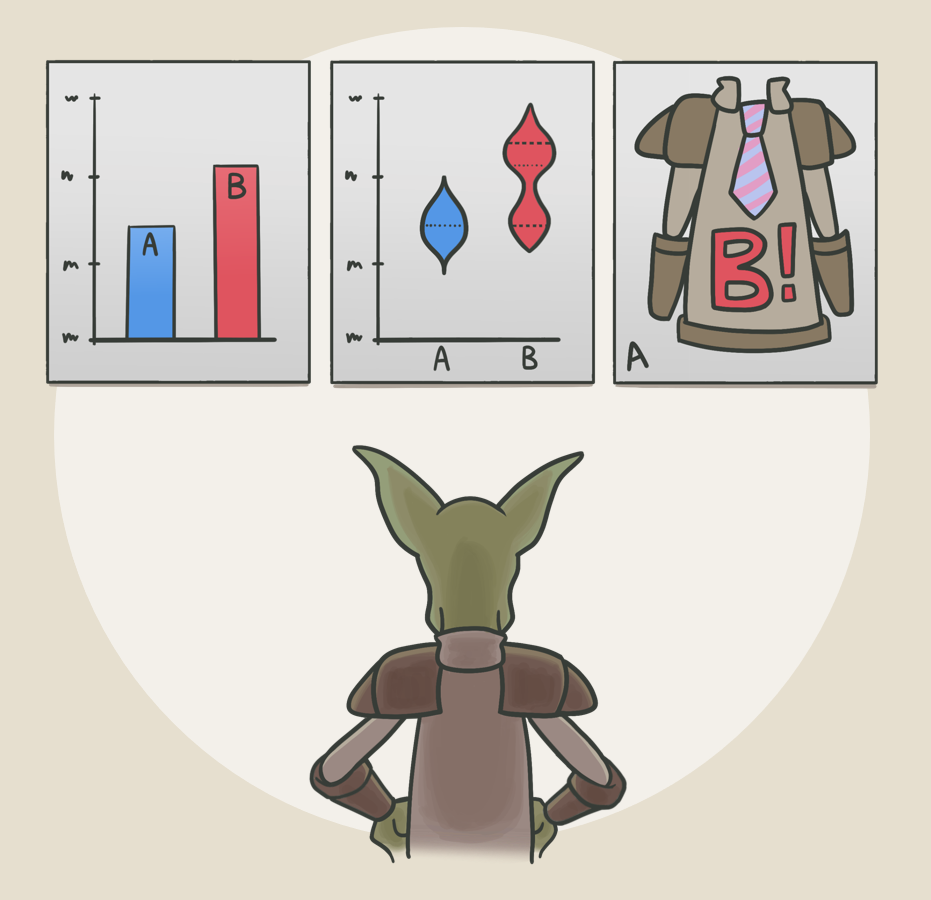
**Once we have a good understanding of who the report is for and the business question we are going to address, we need to find suitable chart types to visualize data in the report.** Further, how that chart type can be (conditionally) formatted and interacted with. The best way to do this is to look at examples such as from these sources:
- [Visual Vocabulary by the Financial Times](https://ft-interactive.github.io/visual-vocabulary/)
- [Big Book of Dashboards](https://bigbookofdashboards.com)
- [Workout Wednesday - Power BI](https://workout-wednesday.com/category/powerbi/)
Once you’ve selected a few options, it’s essential to discuss & explain them with end-users. This will ensure it’s not just the right chart for the data, but for the people using the report. A good way to do this is during the requirements gathering process by creating mock-up or wireframe designs.
### STEP 3: TEST, AND TEST MORE THAN ONCE: TIME-TO-INSIGHT & USER SURVEYS
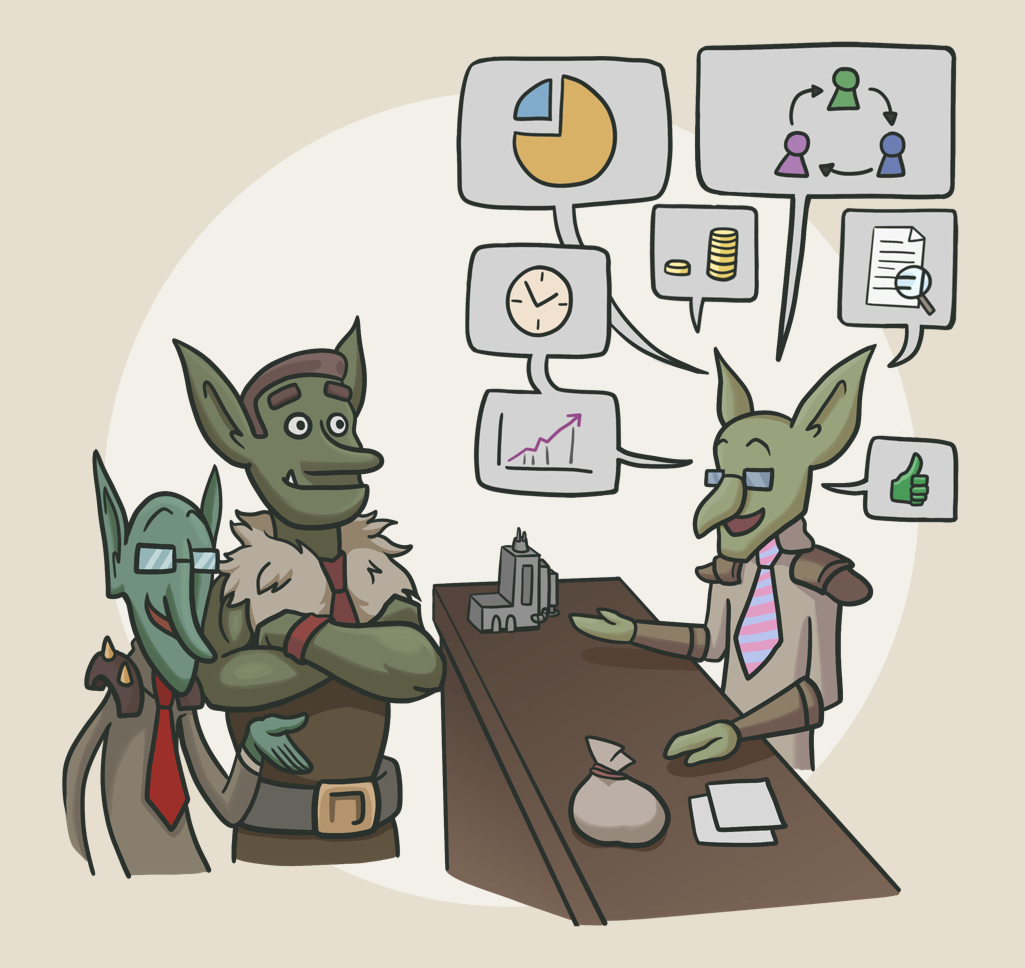
By involving the users in the testing process, you are not only improving the report, but also adoption. Don’t skip testing!
**Despite being a more subjective and nuanced topic, there do exist ways to objectively test the effectiveness of data visualizations.** An advanced example is using [eye-tracking, to see if users are looking at the right places in the report](https://www.tableau.com/resource/eye-tracking-study), or can seek answers on the page when posed questions about the data. This can be done in simpler means; measuring the ‘***Time-to-Insight***’, or how long it takes users to answer a set of questions about the data with one visual compared to another. Alternatively, users can be polled to give subjective feedback about how usable a given report or visual is for them. Aggregating this feedback over the entire user community can give a general sense of whether the approach works or not.
Testing in this case is more inconvenient as it involves the participation and interrogation of users. Regardless, it can be a fun and rewarding exercise that provides real, objective evidence that a report is usable before it reaches production. **It can not only provide evidence to motivate a specific design choice, but also improve report adoption, since users are involved in the development process.**
### STEP 4: IMPLEMENT AND JUSTIFY THE OPTION; OR REJECT IT AND MOVE ON
**Once implemented in a report and used daily, users might find after a time that the visual isn’t ideal.** There may be subtle or nuanced elements to the chart that prove inconvenient. Better yet, there may be ideas or suggestions to change and improve it. Don’t be afraid to address these changes if they can be valuable, or to scrap a visual that clearly isn’t being used or bringing value to the users of a report. Don’t become attached to that custom visual you slaved for hours over to get it to look *just right*.
---
## TO CONCLUDE
**To create good solutions in Power BI, we must incorporate best practices & optimizations in the things we make.** This is challenging, but by following an evidence-based approach, we can more successfully tackle complex problems and improve the quality of our reports & datasets:
---
- **Best practices** are recognized standards that provide a helpful ‘default’ option.
- *They are either **patterns** (DO’s) or **anti-patterns** (DON’Ts).*
- *Some situations might require deviating from best practices*
- *Straying from best practices should only be done if understanding the consequences*
- **Optimization techniques** are possible options that require testing, *not* best practices.
- Optimizing a report or dataset requires an **evidence-based approach** with **propertesting**:
- *Define the problem and the context around it*
- *Research & understand the options available to optimize the dataset or report*
- *Test & compare to the original approach*
- *Tests must be conducted **more than once** to account for uncontrolled variables*
- *Tests must be conducted **in the same conditions** (date, time, machine, etc.)*
- *The selected approach must be justified by the test results*
- *If no difference is observed, we should revert to the original design or approach*
---
*Thanks to *[*Marco Russo*](https://twitter.com/marcorus)* of *[*sqlbi.com*](https://www.sqlbi.com)* for reviewing and providing feedback on this article.*
*Thanks too to *[*Ed Hansberry*](https://twitter.com/ehansalytics)* and *[*Tom Martens*](https://twitter.com/tommartens68)* for discussions that helped inspire this article.*
---
---
- **Use a Star Schema** - [The importance of star schemas in Power BI - SQLBI](https://www.sqlbi.com/articles/the-importance-of-star-schemas-in-power-bi/#:~:text=As%20coined%20by%20Koen%20Verbeeck%2C%20the%20motto%20of,system.%20The%20data%20model%20to%20analyze%20is%20simple.)
- **Connecting Fact Tables** - [Header/Detail vs Star Schema models in Tabular and Power BI - SQLBI](https://www.sqlbi.com/articles/header-detail-vs-star-schema-models-in-tabular-and-power-bi/)
- **Variables in DAX** - [Variables in DAX - SQLBI](https://www.sqlbi.com/articles/variables-in-dax/)
- **Bidirectional relationships / Ambiguity** - [Bidirectional relationships & ambiguity in DAX - SQLBI](https://www.sqlbi.com/articles/bidirectional-relationships-and-ambiguity-in-dax/)
- **Many-many relationships** - [Different options to model many-to-many relationships - SQLBI](https://www.sqlbi.com/articles/different-options-to-model-many-to-many-relationships-in-power-bi-and-tabular/)
- **Calculate in DAX** - [Filter Arguments in CALCULATE - SQLBI](https://www.sqlbi.com/articles/filter-arguments-in-calculate/)
- **Context Transition in DAX** - [Context Transition and Filters in CALCULATE - SQLBI](https://www.sqlbi.com/articles/context-transition-and-filters-in-calculate/)
- **IF.EAGER optimization** - [Understanding eager vs. strict evaluation in DAX - SQLBI](https://www.sqlbi.com/articles/understanding-eager-vs-strict-evaluation-in-dax/)
- **DISTINCTCOUNT optimization** - [Analyzing the performance of DISTINCTCOUNT in DAX - SQLBI](https://www.sqlbi.com/articles/analyzing-distinctcount-performance-in-dax/)
- **RI Violations optimization** - [Clean data = faster reports - Phil Seamark on DAX](https://dax.tips/2019/11/28/clean-data-faster-reports/)
- **Incremental Refresh optimization** - [What is a Refresh Policy? - Tabular Editor](https://docs.tabulareditor.com/te3/tutorials/incremental-refresh-about.html?tabs=filterstep%2Cimport)
- **Edit Interactions optimization** - [Change how visuals interact in a report - Microsoft Learn](https://learn.microsoft.com/en-us/power-bi/create-reports/service-reports-visual-interactions?tabs=powerbi-desktop)
- **Power Query Best Practices** - [Best practices when working with Power Query - Microsoft Learn](https://learn.microsoft.com/en-us/power-query/best-practices)
- **Power BI Dataviz Best Practices** - [Tips for designing a great Power BI dashboard - Microsoft Learn](https://learn.microsoft.com/en-us/power-bi/create-reports/service-dashboards-design-tips)
- **Keep it simple**: [Data Visualization - SQLBI](https://www.sqlbi.com/training/data-visualization/)
- **3-30-300 Rule / Information-seeking Mantra:** [The Surest Path to Visual Discovery](https://www.perceptualedge.com/articles/b-eye/path_to_visual_discovery.pdf) by *Stephen Few*
---
---
 ---
# HOW TO DEAL WITH COMPLEX PROBLEMS
*…and the importance of **critical thinking & evidence-based testing** when optimizing Power BI.*
---
*No time to read a long-form article? That’s fine! This article has an audio version that you can listen to in the background while doing other things. Goblin drawings & cartoons are only in the article, though!*
![audio-thumbnail]()
It Depends
0:00
/0:00
---
## THE GOLDEN RULE OF “IT DEPENDS”

 # BEST PRACTICES & OPTIMIZATIONS
[**I. INTRODUCTION:** BEST PRACTICES & OPTIMIZATIONS](https://data-goblins.com/it-depends)
[** II. PERFORMANCE: **TESTING,REPLICATES & RELEVANCE](https://data-goblins.com/it-depends)
[**III. DATA VISUALIZATION:** TIME-TO-INSIGHT & SUBJECTIVE PREFERENCE](https://data-goblins.com/it-depends)
---
---
### WHAT IS A BEST PRACTICE AND WHY IS IT HELPFUL?
**Best practices are methods to address a problem, recognized as superior to alternative approaches.** This might be something technical, like a DAX or M pattern to solve a particular business requirement, but could also relate to people or processes. Examples here are distributing reports, organizing & documenting datasets, or gathering requirements.
**Best practices typically come in two flavors: DOs (patterns) & DON’Ts (anti-patterns).** They are valuable as they provide ‘default’ options fitting a wide range of scenarios. *Some examples are listed below:*
---
 **Best practices help us make better Power BI solutions.** Because they apply to many cases, they are usually well-understood. As such, they are easy to learn, repeat and teach; paths through the unknown and ‘rules’ for navigation in a wilderness of complexity. When collected, such best practices form the basis of helpful resources like books, documentation or checklists. This is valuable as it communicates a common standard for tools, processes & problems. This standard provides what we *should* do, and *how* we should do it. *However, is this always true?*
Best practices provide valuable default options, but are not obligatory for every situation. Some requirements or problems might require a departure from best practices.** It is important to clarify that this can be dangerous unless handled by an experienced developer.** Deviating from these best practices can produce unintended effects which a novice may not identify or understand, particularly in pursuit of optimization.
**While implementing best practices in a solution can optimize the result, not every optimization is a best practice.** There is a distinct difference between a ***best practice** *and an ***optimization technique.*** Understanding this and how to apply optimizations is essential to make quality Power BI content.
---
### WHAT ARE OPTIMIZATIONS? HOW DO THEY DIFFER FROM BEST PRACTICES?
**An optimization technique is a specific adjustment or addition to a solution that can improve it in a measurable, objective way.** Unlike best practices, optimization techniques must not be considered as default options or standards. Where there is *one* *default best practice* for a particular problem, there are *many possible optimizations*, none of which are guaranteed to actually optimize the solution in question. **In fact, optimizations typically add complexity to an approach or solution, or may even contradict an existing best practice, altogether.** Optimization techniques are situational, they must be deeply understood and tested *before* being applied. There are typically more nuances & elements to consider than when applying a best practice.
---



 **When performance becomes a concern, it’s first important to define the context and the (potential) impact.** It helps to take a step back and clearly answer some questions, like:
- *What is the objective, here? What is this calculation or query trying to do?*
- *What problem are we trying to solve with this query / expression / visual?*
- *Where and how would we get performance issues? Can they prevent us from reaching our objective?*
- *What part of this context can we control or change?*
- *What part of this context do we have no influence over? Why are we powerless to change it?*
- *What would happen if we do nothing? If we stick with the plan?*
The goal is to identify what the solution should do that the performance issues are preventing, and where in the solution we should look for bottlenecks. Defining the context makes sure we know what the ultimate goal is, and we don’t get distracted by technical details.
The query to that DirectQuery table might be slow, but is the objective to have a fast query? No, probably not. The objective is to show *Sales MTD*, to count *Number of Returning Customers *by region, and so on — to address the business requirement, and to do it in a performant manner. Don’t lose sight of the bottom line.
### STEP 2: UNDERSTAND THE AVAILABLE OPTIONS OR APPROACHES
 **Once we identify the objective and bottleneck, we must find & understand our options to optimize it.** This is already a difficult challenge; we will not have a library of patterns from which we can make a selection. Instead, we need to research and experiment with the identified bottleneck. In many cases, this may require reading or re-visiting theoretical or instructional documentation (such as from [learn.microsoft.com](https://learn.microsoft.com/en-us/training/powerplatform/power-bi), [sqlbi](https://www.sqlbi.com), and [other trustworthy sources](https://blog.crossjoin.co.uk)) to better understand how the bottleneck is occurring and what we might do about it.
**This usually results in a list of possible options; different approaches, adjustments, or full patterns to address the problem.** It’s not sufficient to simply gather these options, however. It’s important to understand how they work and what effect they might have. Why are they possible solutions; how can help us reach our objective? This is obviously a lot more work, but will lead to a better understanding of the problem and thus why the eventual solution is a good fit.
### STEP 3: TEST, AND TEST MORE THAN ONCE
 Depending on when & how you test, you will get different results. In the above graph, a poorly-performing report page was tested with the ‘Performance Analyzer’ in Power BI Desktop at different times in the day, without any changes to the report or model. Dramatically different results are observed at different times, perhaps due to activity on the dataset and dedicated capacity, but could also be due to transient effects from a local network or VPN. This graph is a Violin Plot custom visual by Daniel Marsh-Patrick which shows well the variation in tests
---
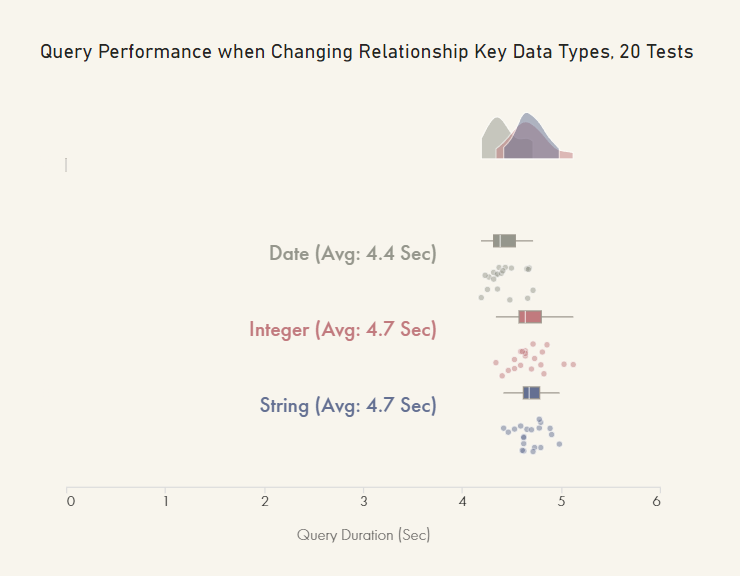 Challenge dogmas and assumptions. It’s often assumed that using integers for fields and keys will result in better performance, despite evidence already showing it does not , because it’s a best practice in relational modelling. In the above, we see no significant improvements in query time when changing the data type of fields used in the relationship. This chart was made by adapting the Raincloud Labelled Deneb template from Kerry Kolosko
---
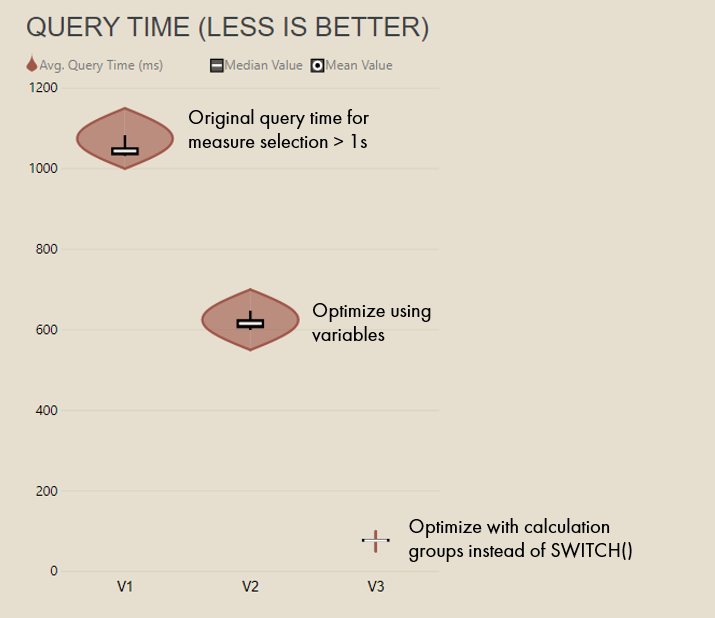 An example of an optimization test with two options tested vs. original, 10 times each. The original - a MTD Sales vs. Target visual - relied on a SWITCH() statement to dynamically select the target. Using a different approach with calculation groups (V3) resulted in average query times 10x faster than the original, so they were implemented in the model. This graph is a Violin Plot custom visual by Daniel Marsh-Patrick which shows well the variation in tests
---
### STEP 4: IMPLEMENT & JUSTIFY THE OPTION; OR REJECT IT AND MOVE ON
 **If done correctly, the performance testing should provide evidence for one of the options or changes as having the best effect.** Alternatively, they may reveal that none of the options produce the desired result; that there’s no significant difference between the proposed optimization and the original solution.
If this is the case, it’s important to revert to the original, as there’s no evidence to justify the change. The original solution is also usually simpler, too.
---
Following an evidence-based approach provides a structured and objective method to understand and optimize performance issues in a Power BI solution. While it takes more time and effort, it will help you better understand the problem, learn the possible optimizations, and justify the selected approach.
*This approach is clear for quantitative problems like slow reports, but what about report design? Can this approach be applied to help us design reports with complex requirements, too?*
 During the requirements-gathering process, we should aim to get a sufficient understanding of the problem and its context. **Here the context is all about the users and the particular business problem they are trying to address in the report.**
- *What question are we trying to answer?*
- *What will we do with the data?*
- *How will it help us answer this problem?*
- *How will we use this visual; how will we interact with it? Do we expect to use drill-through, drill-down or other, more advanced actions?*
- *What solutions are we using today to answer this question (visuals, reports, or other things) and why do they / don’t they work?*
### STEP 2: UNDERSTAND THE AVAILABLE OPTIONS: CHART TYPES & FORMATTING
 **Once we have a good understanding of who the report is for and the business question we are going to address, we need to find suitable chart types to visualize data in the report.** Further, how that chart type can be (conditionally) formatted and interacted with. The best way to do this is to look at examples such as from these sources:
- [Visual Vocabulary by the Financial Times](https://ft-interactive.github.io/visual-vocabulary/)
- [Big Book of Dashboards](https://bigbookofdashboards.com)
- [Workout Wednesday - Power BI](https://workout-wednesday.com/category/powerbi/)
Once you’ve selected a few options, it’s essential to discuss & explain them with end-users. This will ensure it’s not just the right chart for the data, but for the people using the report. A good way to do this is during the requirements gathering process by creating mock-up or wireframe designs.
### STEP 3: TEST, AND TEST MORE THAN ONCE: TIME-TO-INSIGHT & USER SURVEYS

 **Once implemented in a report and used daily, users might find after a time that the visual isn’t ideal.** There may be subtle or nuanced elements to the chart that prove inconvenient. Better yet, there may be ideas or suggestions to change and improve it. Don’t be afraid to address these changes if they can be valuable, or to scrap a visual that clearly isn’t being used or bringing value to the users of a report. Don’t become attached to that custom visual you slaved for hours over to get it to look *just right*.
---
 ## TO CONCLUDE
**To create good solutions in Power BI, we must incorporate best practices & optimizations in the things we make.** This is challenging, but by following an evidence-based approach, we can more successfully tackle complex problems and improve the quality of our reports & datasets:
---
- **Best practices** are recognized standards that provide a helpful ‘default’ option.
- *They are either **patterns** (DO’s) or **anti-patterns** (DON’Ts).*
- *Some situations might require deviating from best practices*
- *Straying from best practices should only be done if understanding the consequences*
- **Optimization techniques** are possible options that require testing, *not* best practices.
- Optimizing a report or dataset requires an **evidence-based approach** with **propertesting**:
- *Define the problem and the context around it*
- *Research & understand the options available to optimize the dataset or report*
- *Test & compare to the original approach*
- *Tests must be conducted **more than once** to account for uncontrolled variables*
- *Tests must be conducted **in the same conditions** (date, time, machine, etc.)*
- *The selected approach must be justified by the test results*
- *If no difference is observed, we should revert to the original design or approach*
---
*Thanks to *[*Marco Russo*](https://twitter.com/marcorus)* of *[*sqlbi.com*](https://www.sqlbi.com)* for reviewing and providing feedback on this article.*
*Thanks too to *[*Ed Hansberry*](https://twitter.com/ehansalytics)* and *[*Tom Martens*](https://twitter.com/tommartens68)* for discussions that helped inspire this article.*
---
---
- **Use a Star Schema** - [The importance of star schemas in Power BI - SQLBI](https://www.sqlbi.com/articles/the-importance-of-star-schemas-in-power-bi/#:~:text=As%20coined%20by%20Koen%20Verbeeck%2C%20the%20motto%20of,system.%20The%20data%20model%20to%20analyze%20is%20simple.)
- **Connecting Fact Tables** - [Header/Detail vs Star Schema models in Tabular and Power BI - SQLBI](https://www.sqlbi.com/articles/header-detail-vs-star-schema-models-in-tabular-and-power-bi/)
- **Variables in DAX** - [Variables in DAX - SQLBI](https://www.sqlbi.com/articles/variables-in-dax/)
- **Bidirectional relationships / Ambiguity** - [Bidirectional relationships & ambiguity in DAX - SQLBI](https://www.sqlbi.com/articles/bidirectional-relationships-and-ambiguity-in-dax/)
- **Many-many relationships** - [Different options to model many-to-many relationships - SQLBI](https://www.sqlbi.com/articles/different-options-to-model-many-to-many-relationships-in-power-bi-and-tabular/)
- **Calculate in DAX** - [Filter Arguments in CALCULATE - SQLBI](https://www.sqlbi.com/articles/filter-arguments-in-calculate/)
- **Context Transition in DAX** - [Context Transition and Filters in CALCULATE - SQLBI](https://www.sqlbi.com/articles/context-transition-and-filters-in-calculate/)
- **IF.EAGER optimization** - [Understanding eager vs. strict evaluation in DAX - SQLBI](https://www.sqlbi.com/articles/understanding-eager-vs-strict-evaluation-in-dax/)
- **DISTINCTCOUNT optimization** - [Analyzing the performance of DISTINCTCOUNT in DAX - SQLBI](https://www.sqlbi.com/articles/analyzing-distinctcount-performance-in-dax/)
- **RI Violations optimization** - [Clean data = faster reports - Phil Seamark on DAX](https://dax.tips/2019/11/28/clean-data-faster-reports/)
- **Incremental Refresh optimization** - [What is a Refresh Policy? - Tabular Editor](https://docs.tabulareditor.com/te3/tutorials/incremental-refresh-about.html?tabs=filterstep%2Cimport)
- **Edit Interactions optimization** - [Change how visuals interact in a report - Microsoft Learn](https://learn.microsoft.com/en-us/power-bi/create-reports/service-reports-visual-interactions?tabs=powerbi-desktop)
- **Power Query Best Practices** - [Best practices when working with Power Query - Microsoft Learn](https://learn.microsoft.com/en-us/power-query/best-practices)
- **Power BI Dataviz Best Practices** - [Tips for designing a great Power BI dashboard - Microsoft Learn](https://learn.microsoft.com/en-us/power-bi/create-reports/service-dashboards-design-tips)
- **Keep it simple**: [Data Visualization - SQLBI](https://www.sqlbi.com/training/data-visualization/)
- **3-30-300 Rule / Information-seeking Mantra:** [The Surest Path to Visual Discovery](https://www.perceptualedge.com/articles/b-eye/path_to_visual_discovery.pdf) by *Stephen Few*
---
---