# Five Minutes to Wow
> I reflect on the subjective similarities between using AI-assistive coding tools to make software and using Tableau and Power BI to make dashboards and reports. This is a more anecdotal story than a formal article.
- URL: https://data-goblins.com/five-minutes-to-wow
- Author: Kurt Buhler
- Published: 2025-08-14
- Topic: AI and coding agents
# "YOU CAN JUST MAKE THINGS"
*Some thoughts and anecdotes about AI tools, user enablement, and technical debt.*
---
**To me, the magic of tools like Power BI and Tableau was how quickly you could create something impressive.** Power BI used to encapsulate this perfectly with their [***five-by-five***](https://www.madrona.com/james-phillips-mark-nelson-produce-led-growth-and-scaling/): *5 seconds to sign up, and 5 minutes to wow!* In five minutes, a businessperson from a non-technical background and some average data/computer literacy could do things in Power BI that really made them say… *wow!*
*Honestly, I don’t know why Microsoft ever stopped using that phrase…*
Anyway, my business intelligence journey didn’t actually start with Power BI. Or Microsoft. It started with Tableau. I’d heard about Tableau from a guy at the gym, who told me his colleague used it in their work, as a data visualization consultant:
“Wait a minute,” I said upon hearing his explanation, “You’re telling me there’s a *job* where you’re *paid* to *make graphs* and *analyze data?*” It sounded like a dream come true, “I just have to learn this Tableau thing?”
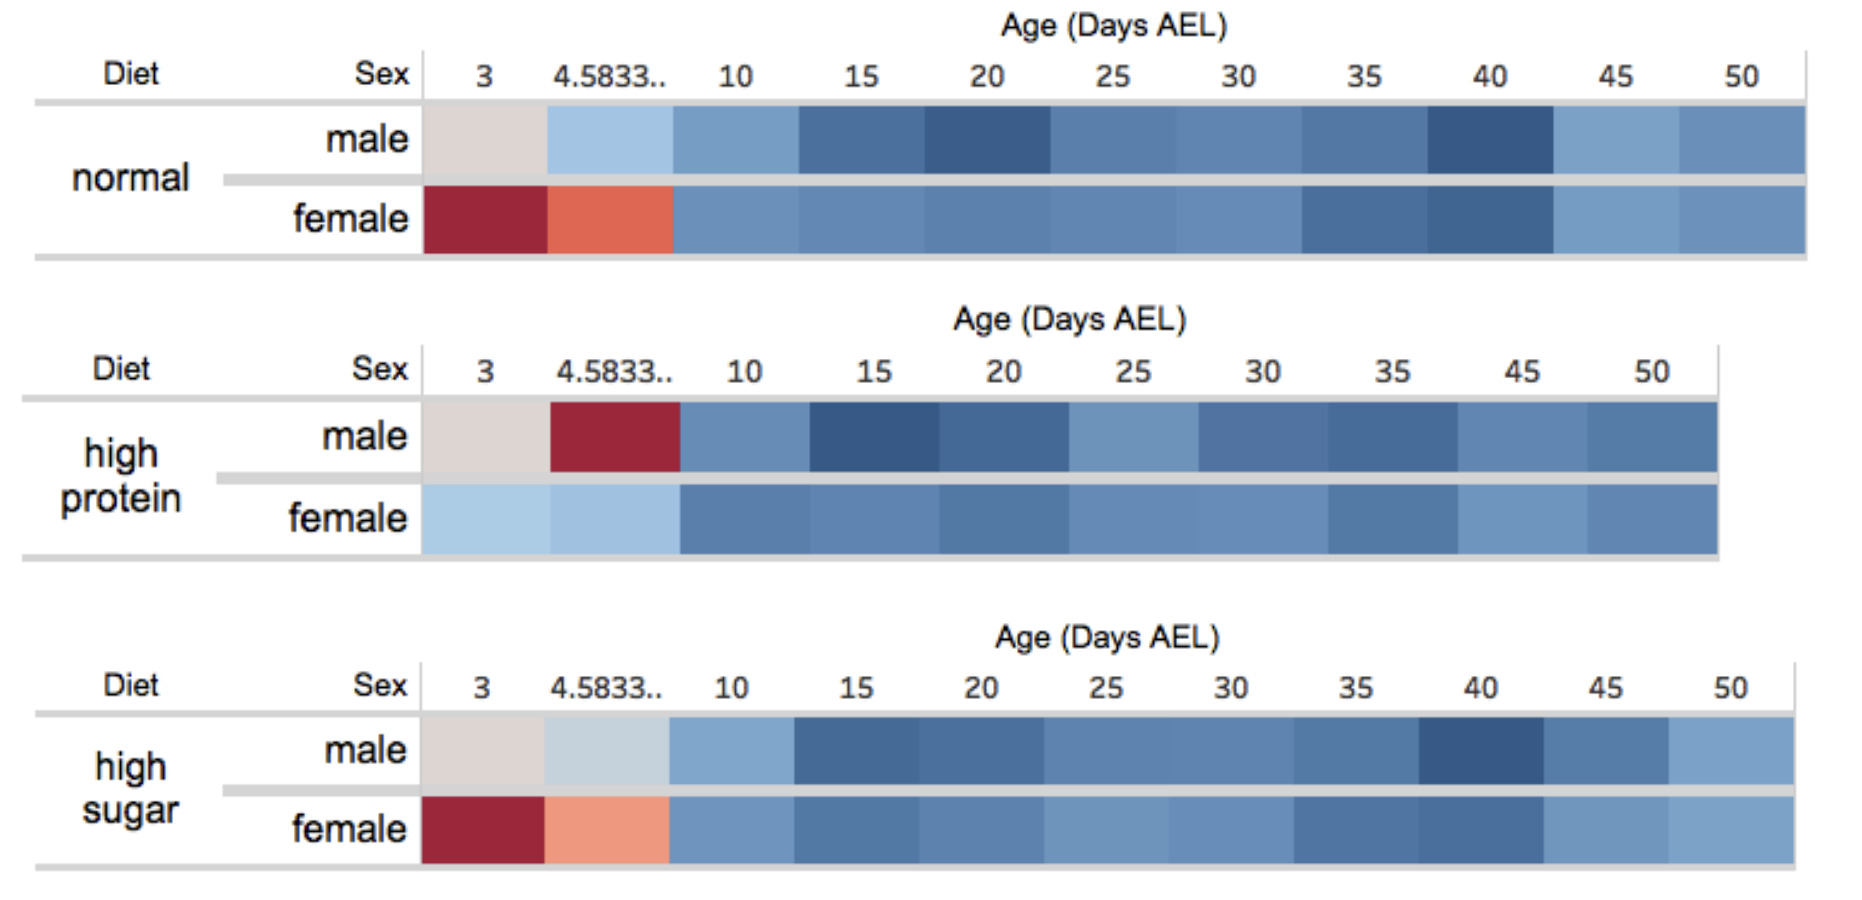
So, completely oblivious to business intelligence altogether, I started a trial in Tableau. Back then I worked in scientific research, so I just took it for a spin on some of my own research project data. I still remember the first charts I made in Tableau.
At this stage in my career:
- I had limited to no programming knowledge, whatsoever (I didn’t even know what SQL *was*, nevermind how to write it).
- I had no technical know-how about databases, data formats, or transformation (I once misunderstood “JSON data” as literally “Jason’s data”. I also had never even heard of or done a VLOOKUP, before).
- I had no knowledge at all about data visualization best practices; just an overall interest and gut feeling for design (the only other data visualization tool I used was GraphPad Prism and Google Sheets… that’s right… I didn’t even use Excel).
**Well, within minutes, by using the elegant user interface of Tableau alone, I had made something that *felt* impressive to me** (remember the word *felt* because it’s going to come back, later). With the user interface, it was *so easy* to transform and filter my data, and even easier to drag and drop various elements to make charts. Then, dynamically filtering them and exploring how the data changed was something new altogether. Having never used an interactive dashboard before, it wasn’t something I even considered with my own data. Needless to say… I was hooked.
I had always seen these impressive charts and visuals created by other scientists. They were elaborate constructions made with Python, R, or Javascript. The notion that I could ever make something like that didn’t just seem impossible… *it seemed silly*. It felt so far beyond my reach, like looking at a lake you had to cross before learning how to swim.
Every attempt I made before then to learn Python or R failed, as I flopped through Datacamp tutorials and Udemy courses. I felt like a fool dogpaddling in knee-high water with a lifejacket, no closer to my goal of creating those charts unless I jumped in headfirst with a deep time commitment that I simply couldn’t afford. **Then came Tableau… *and it was like getting on a jetski.***
Suddenly, ideas wormed their way in my brain. *I can make these graphs, now, *I thought. I spent the rest of the evening watching tutorial videos and figuring out how to make what I wanted.
The next day, I was showing anyone and everyone some of the things that I had made, and explaining this new amazing tool that I made it in. Overnight I became a Tableau user. Not just a user… an enthusiast. You see, I didn’t care about Tableau. I cared about the things I made with it, and how it made me feel.
Tableau gave me a sense of pride. It gave me a sense of discovery. It suddenly made me feel like I could *do more; *make things that I never thought I could make with my current skillset.
Were the things I made objectively *good? *No, not really. But to me at the time, it was ***awesome***. Witness the gory display of my first-ever Tableau dashboards for yourself, below:
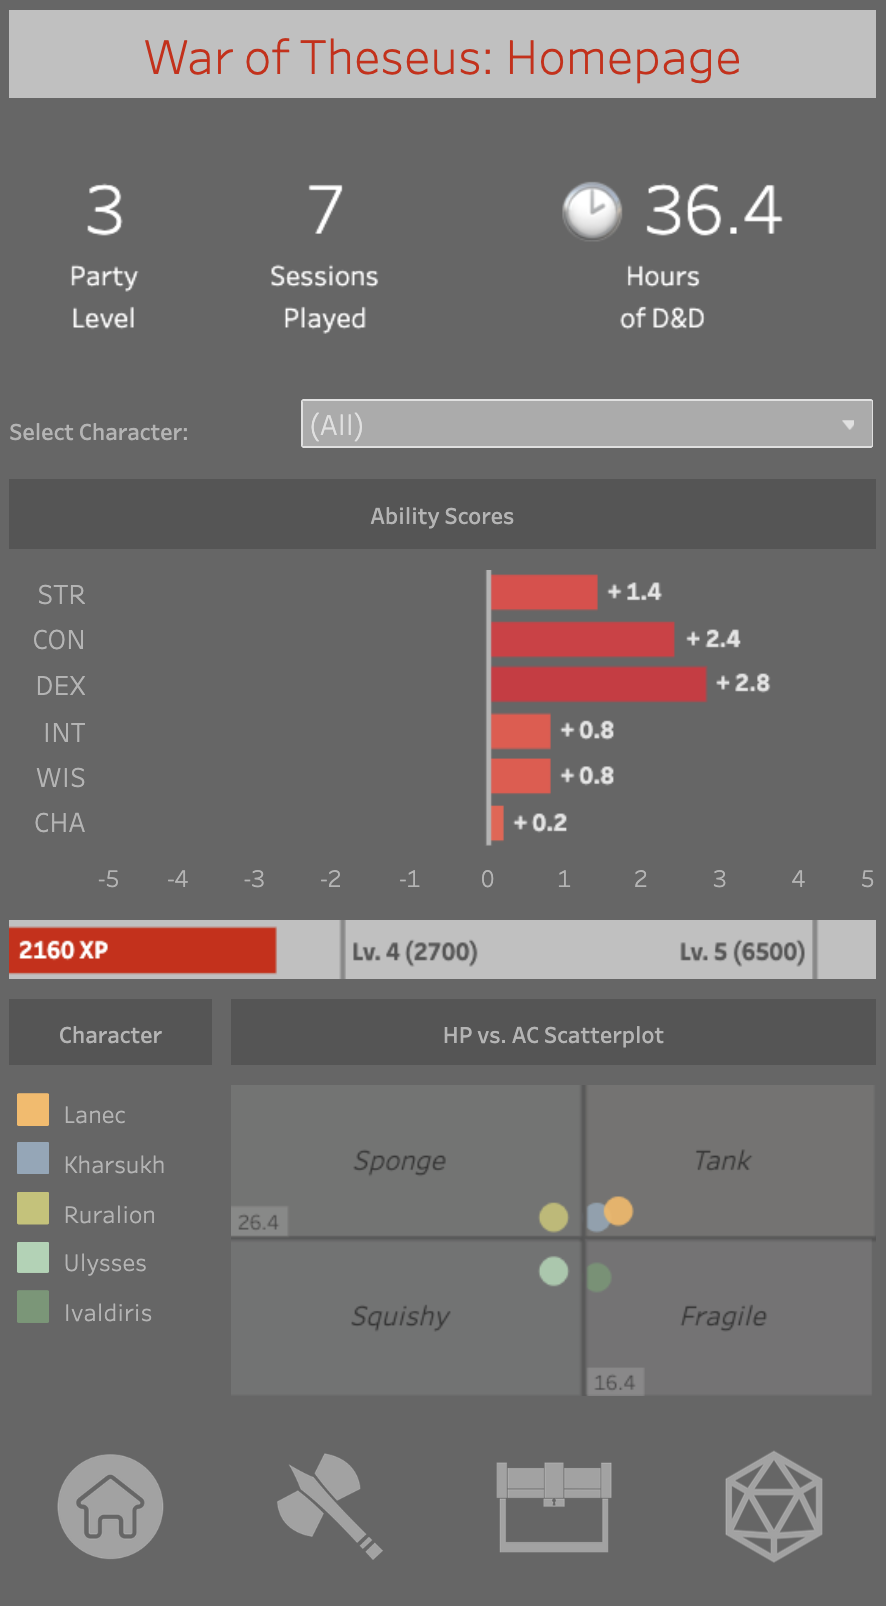
Lightning in a bottle.
**Lightning struck twice.** Fast-forward about a year later, and I was working as a data visualization consultant. Except, I wasn’t working with Tableau… there were no Tableau projects for juniors for me, at the time. So, I was on the bench, learning Power BI.
I remember vividly my first experiences with Power BI:
I remember the first time I saw a semantic model. A bunch of grey boxes connected by lines and arrows.
*“What the fuck is this,”* I literally said out loud.
*"That's a relationship between tables,"* my colleague explained, moving his finger between the two table meatballs among the jutting grey spaghetti. I got a headache trying to follow the arrows from box-to-box.
*“Why are they in a relationship? Why do we even have multiple tables… this seems so complicated… can’t we just combine it into one table, instead?”* I asked.
Yeah…
I remember the first time I saw DAX.
I remember typing things like *‘Sales’[Units Sold] * ‘Sales’[Price]* in a measure to get an error. Confused, I figured out that I needed to aggregate them with functions. Then, I made a calculated column, using these same functions, and was confused when it repeated the totals over every row.
*Yeah…*
I remember the first time I published something to a workspace in the Power BI service, and how it felt like discovering another software hidden behind the first. *“What the heck is this… Why can’t I just share the PBIX file?”* I thought to myself.
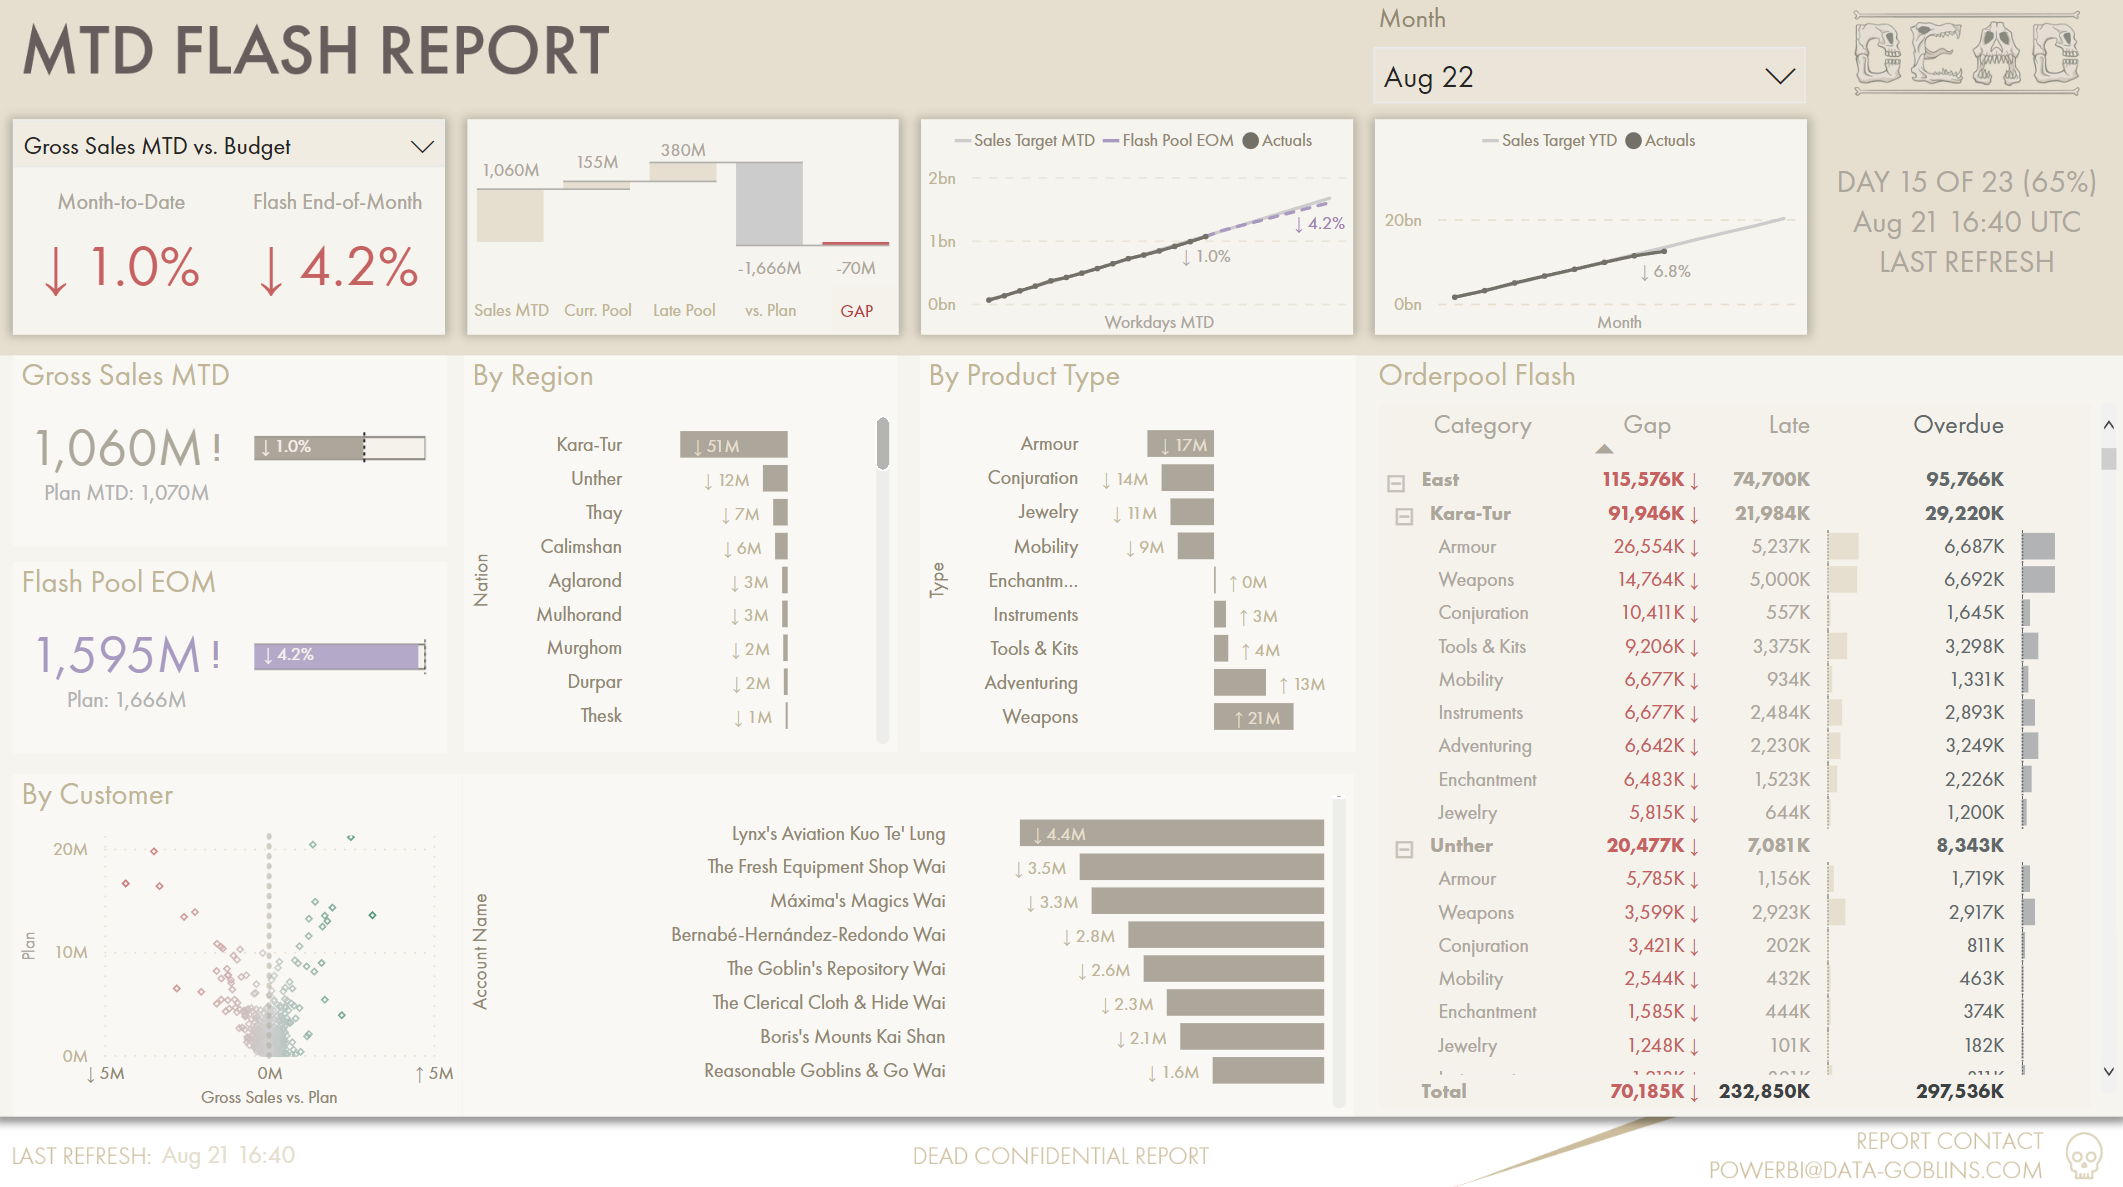
Here’s that very first Power BI file that I ever made (again, for an internal learning project, and not a client):

*YEAH…*
I still remember making that first report. Adding visuals to the Power BI canvas, I was blown away the first time I experienced cross-filtering. Selecting one visual and having it automatically filter the rest without me doing anything to set it up… it felt like magic. And it was *so fast.* Within a few minutes, you could have visuals on a page and click around to see how the data changed… *wow.*
It wasn’t taking long for me to feel more comfortable with making reports in Power BI. Of course I practiced making reports and data models on only the most serious projects:
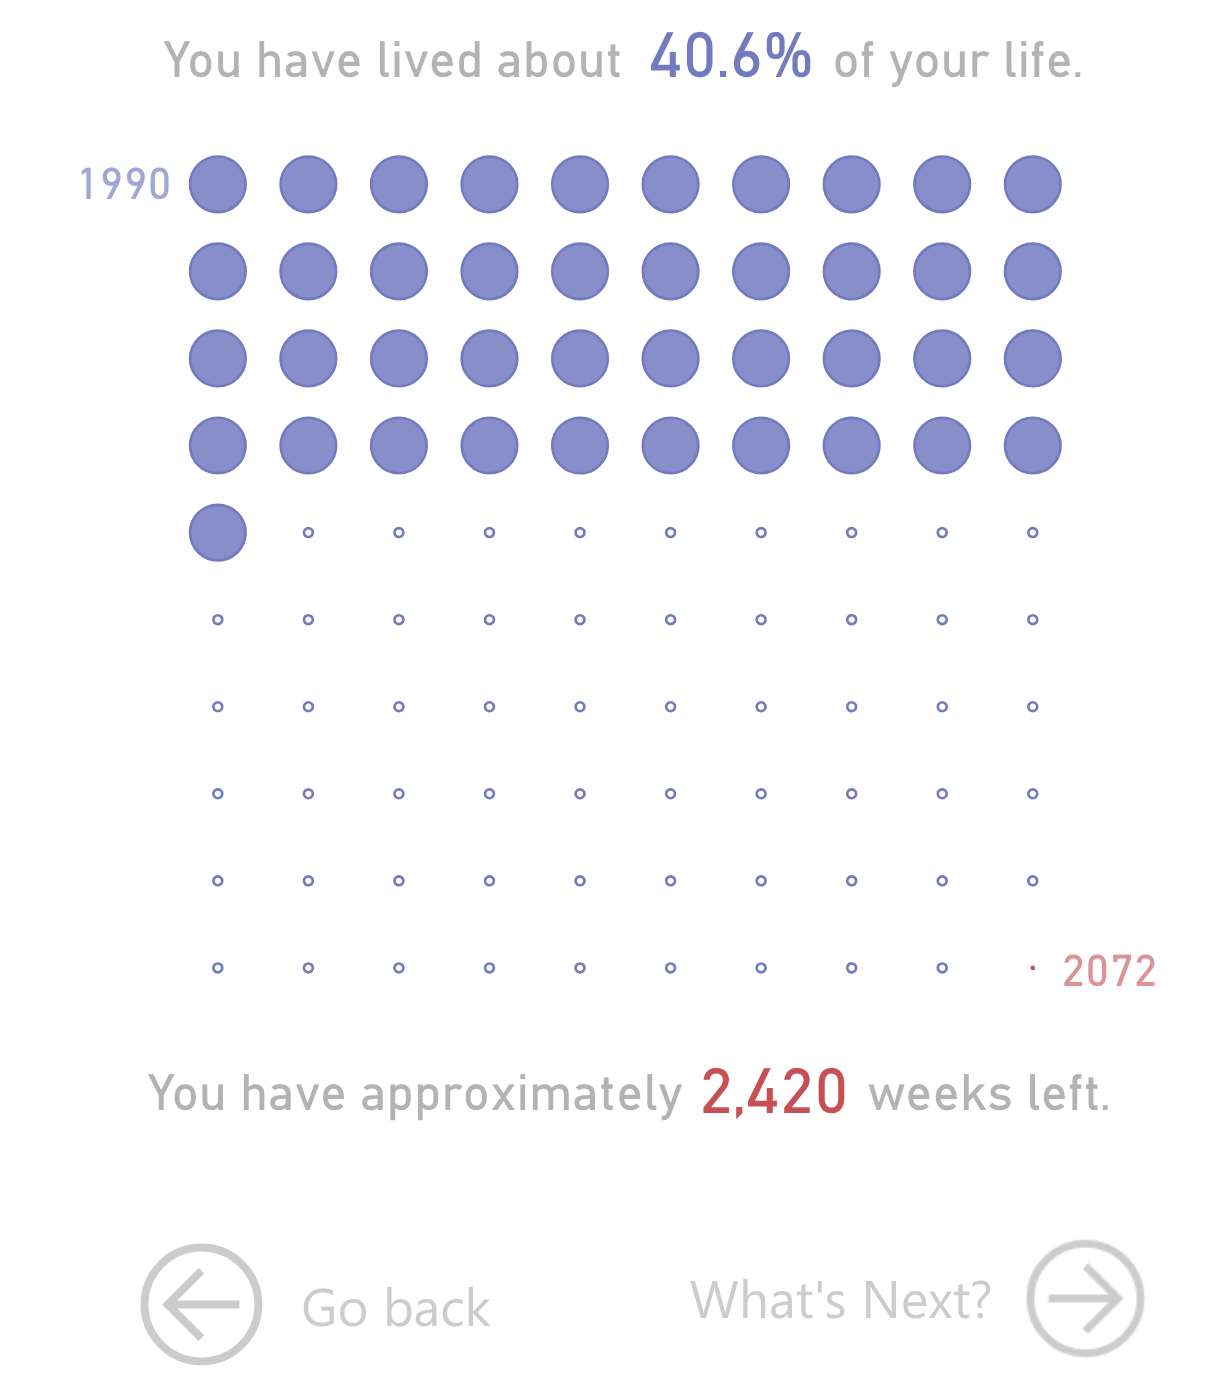
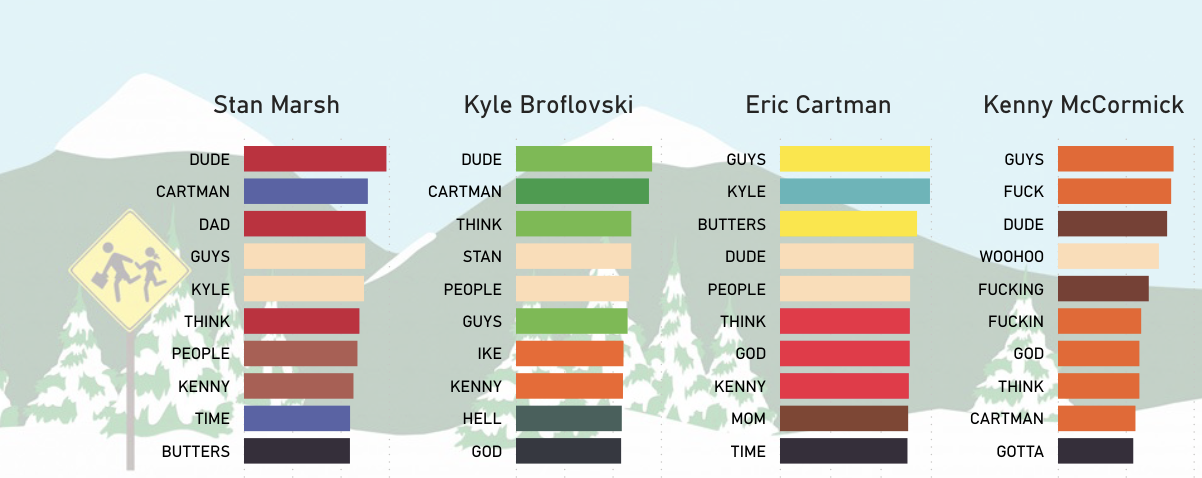
A report that calculates how much longer you have left to live. If you click “What’s next” it shows a black screen.Analysis of South Park episode scripts.Analysis of the V1 of my D&D dataset.
**Obviously, a lot has changed since then. *I’ve learned a lot* since then.** But I share the above points for a reason: I was really, *really *ignorant to the technical gears and cogs behind Tableau and Power BI. And yet, I could make reports and dashboards. *Useful* reports and dashboards (ones for clients that I can’t share obviously, and not ones about swear words in South Park). Now, that might evoke a strong emotional response from some more technically-minded readers, but I encourage you to sit tight and read to the end.
I also share this story because I think it’s quite relatable. Self-service, low-code tools like Tableau and Power BI ignited careers for me and many, many others. People who don’t come from a background in IT, computer sciences, or engineering. People who *just wanted or needed to make things*.
Not just *things*, either… *useful things*. Despite not knowing the technical details of star schemas, DAX filter context, or query folding… many people *could* really make useful reports and dashboards from their data. This was a truth that was empowering for many, but uncomfortable for some: *you don’t need deep technical knowledge to make useful reports or dashboards*. Tools like Power BI ignited this bottom-up revolution where non-technical people were empowered to make technical things and grow to be a part of that world. Again, if you feel a strong emotional reaction to argue with that statement… sit tight.
**This feeling of creating something tangible and useful was powerful. It was electric, and I strongly believe that it is one of the reasons why tools like Power BI have seen such dramatic increases in adoption over the years.** *Five minutes to wow* wasn’t just a marketing mantra… for many people like me, it was the honest-to-god truth of the customer experience.

The lightning was out of the bottle, and it was contagious. It wasn’t getting back in… no matter how badly some people wanted it to.
**Of course, lightning strikes can also cause fires, too.**
---
# “YOU CAN’T JUST PUT THIS INTO PRODUCTION”
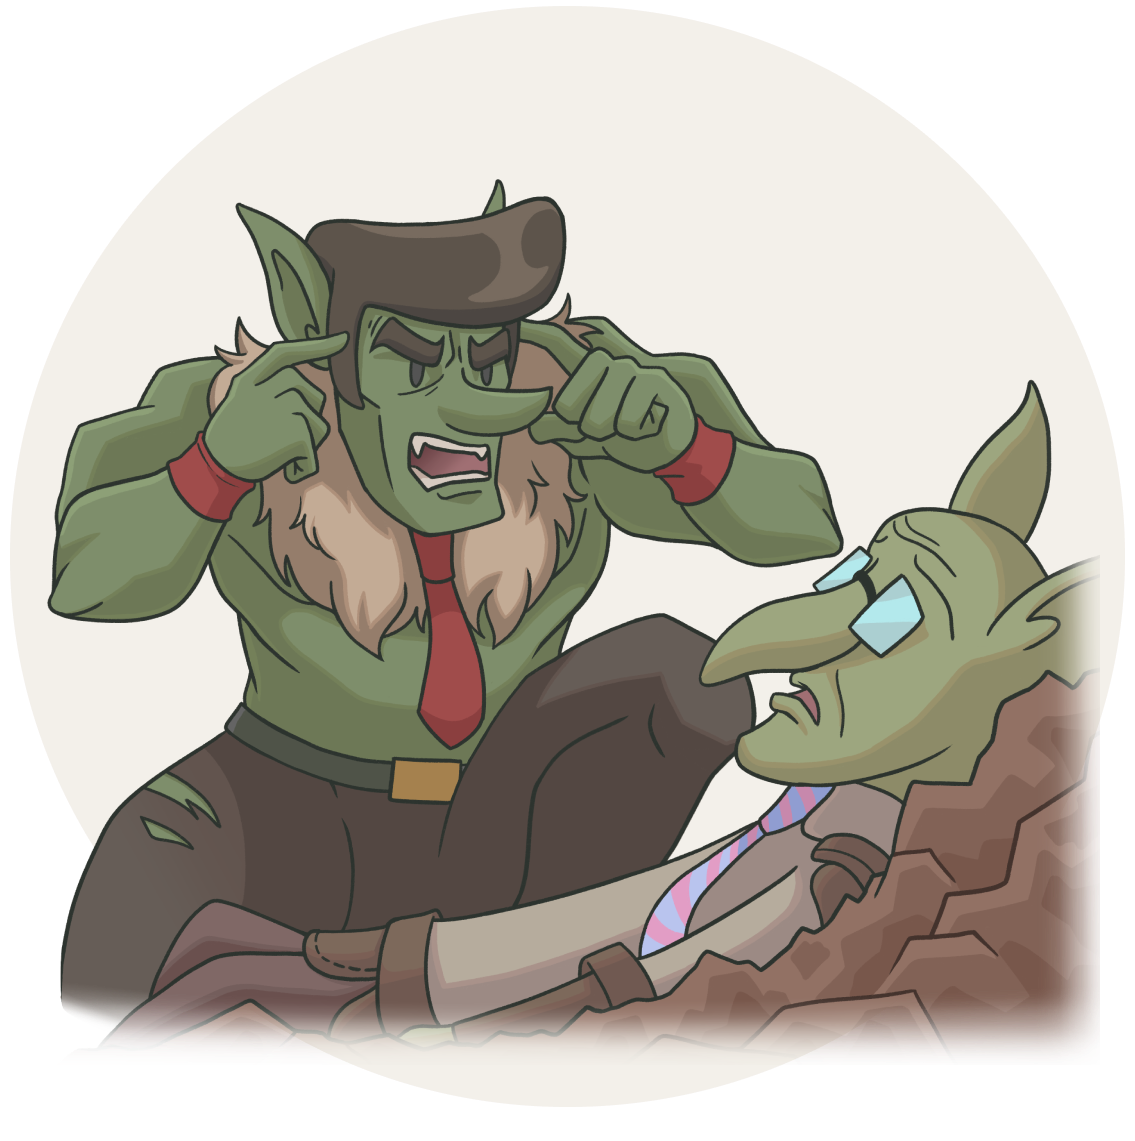
Low-code and no-code tools like Power BI and Tableau *felt* like magic, because suddenly, users could bypass technical barriers and make useful things quite quickly. However, as we all know… there’s no such thing as magic. It’s one thing to make a Tableau or Power BI dashboard for a demo, a proof-of-concept, or an analysis of a few worksheets from Excel. It’s another thing to make a dashboard from organizational data for daily use by a team or department.
Just because the technical bits are skipped doesn’t mean that they don’t exist. You can lower technical barriers for people to build things, but the barriers to reach a mature, sustainable, and secure data product are higher, and drop at a significantly lower rate. Neglecting that creates technical debt, which can be… painful.
As tools like Power BI and Tableau grew in popularity, it became commonplace to hear growing pain stories. People struggled with performance, DAX, reporting requirements, and a great deal of many other things.
It also became commonplace to hear how Tableau and Power BI became an epicenter for conflict between central IT teams and decentralized or self-service business teams:
**IT was often blindsided by this bottom-up adoption of a reporting tool**, with new dashboards that created business process dependencies or absorbed both technical and FTE resources. There also often came demand from key users and executives, who—impressed by the dashboards shown or emailed to them—wanted to scale and expand their use. Unheard concerns about governance, security, and sustainability often boiled into frustration. Dashboard creators were often decried as naïve and ignorant about the resources needed to turn their grassroots personal project into a sustainable enterprise reporting solution.
**Business often didn’t understand the (usually valid) concerns from IT, which they saw as resistance** and pushback preventing them from moving faster and getting what they wanted. Sometimes, if IT locked the door, then business would break a window. Shadow IT became all too commonplace, as some teams sought to circumvent IT altogether. They hired their own technical consultants and set up their own technical resources with copies of data, which often only compounded risk and cost.
Even beyond this conflict, Power BI implementations often clipped the curb. Organizations struggled with many challenges, like missing features (even if they existed in Analysis Services), an inflexible and inefficient report creation experience (which is still the case, if I’m honest) and support for enterprise scenarios. Adoption struggles became a common issue as many teams realized the bottleneck to a successful use of Power BI was more about user enablement and data culture than it was about technical features and practices. Conversations among report creators were often less about certain features and more “how can I get my users to stop exporting to Excel / using the old Excel reports?”
A common story was a reporting project that started off simple and useful. However, eventually, cumulating complexity or size snowballed over time. Simple, finely-scoped models became bloated monsters with query and refresh performance issues, a maze of dependant objects, and no documentation. Reports became clunky and inflexible, as the creators struggled to find ways to show the data they wanted to. It wasn’t uncommon to hear about report creators defeated by the “export to Excel” button or becoming disillusioned and switching to another reporting tool.
There was a pattern that emerged: it was quick and easy to make small dashboards with simple scenarios. Consultants will often tell you they can make reports in days… or even hours. However, scaling these things to more data, users, and business areas is… more complex. More difficult. More painful. For a lot of Power BI users—me included—discovering these technical teeth and barbs hidden beneath the surface was not very… *wow*.
**In short, the promises and short-lived euphoria of these low-code/no-code tools often ran aground when they needed to scale.** When confronted with real deployment, enterprise scenarios, and security risks, self-service teams lacked the maturity and technical experience to navigate this successfully.
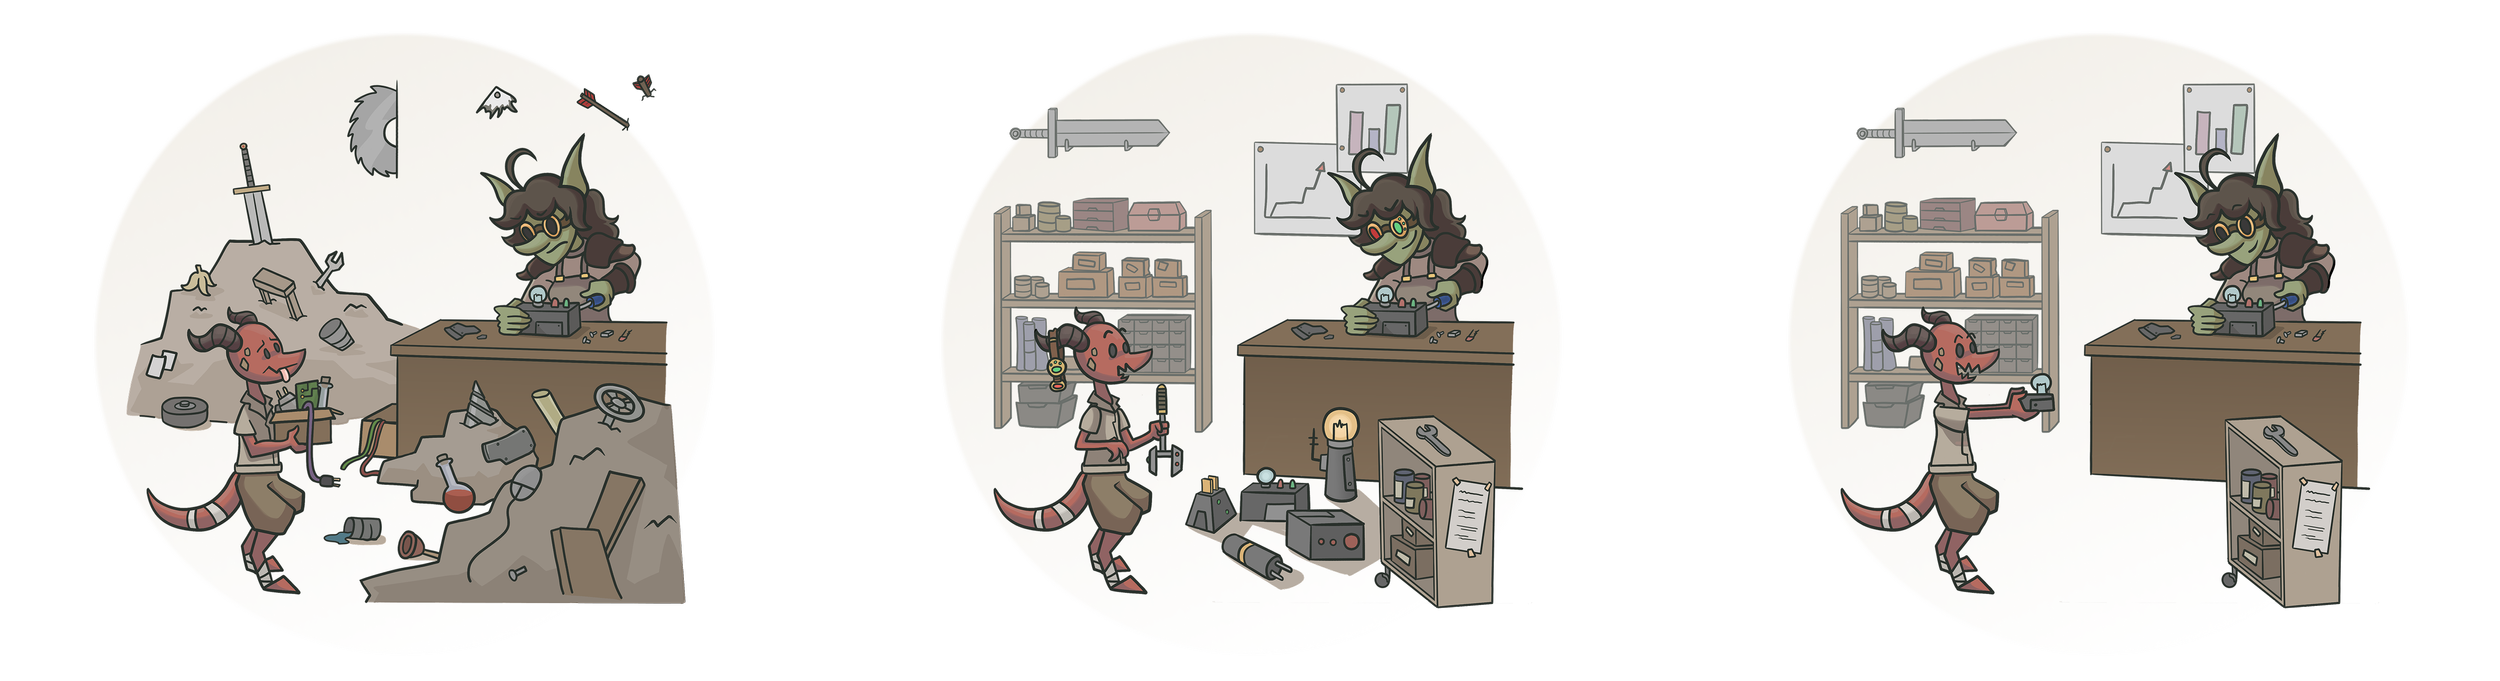
So, they learned. Some slower and more painfully than others… but *we* *all learned*.
This collision didn’t doom these tools, of course. Rather, confrontation with reality and scale forced the tools and their users to grow. Power BI users from a non-technical background have undoubtedly grown their technical knowledge *because of *Power BI. Furthermore, Power BI as it exists today—while not without its flaws—is definitely a more robust, sophisticated tool that can support enterprise reporting scenarios, and much more.
Now—a few years later—we’re experiencing another wave of new tools and technology driven by the tsunami that is AI. Agentic coding tools like [Cursor](https://cursor.com/agents), [v0](https://v0.app/), [Replit](https://replit.com/), [Claude Code](https://www.anthropic.com/claude-code) and others are enabling a wave of non-technical creators to build with code by prompting AI. This is commonly referred to as “[vibe coding](https://x.com/karpathy/status/1886192184808149383?lang=en)”; focusing on the desired outcome and using natural language engagement with AI, rather than the code itself.

*Vibe coding* has emerged as somewhat of a cultural phenomenon for many. It’s also got a *particularly* toxic discourse, among which are some promising signs of something special happening, albeit accompanied by some *very* valid concerns and serious caveats.
For the last year, I’ve been wading ever deeper into the murky, frothing, rising sea that is AI. From Copilot in Power BI to command-line tools and asynchronous agents, I’ve been exploring, researching, and testing these things to better understand how they work and when or why they are useful for me (if at all). Not just in Power BI and Fabric, but in general. I haven’t really shared that much about this, yet.
---
# “HEY CLAUDE, LET’S CONTINUE ON THIS…”

**A few months ago, I used AI to help me make a web application for the first time.** It helps manage the custom rules and setting of our D&D game. Something small… personal use. Within some hours, I had something functional and reliable for our needs that replaced a dozen publish-to-web Power BI reports (which I regularly use in demos), scattered Google Docs documents and a few webpages. Seeing and click through the working application for the first time, it immediately threw me back to my first Tableau visuals.
Lightning, again.
A year ago, the idea of coding and deploying full-stack software for my own use would have been unthinkable. Now, it seems like a weekly activity; so much more seems possible than ever before. The passionate enthusiasm I first felt with Tableau and Power BI has resurfaced in the form of Claude Code, Gemini CLI, and others.* Five seconds to sign up… five minutes to wow.*
**Again, it *felt* like magic… but magic doesn’t exist. Software doesn’t run on *feelings*.**
I’ve spent many hours debugging random AI-generated mistakes in code, backtracking on design mistakes from earlier sessions I wasn’t even aware I made, or trying to fumble my way through deployment with services, languages, and frameworks that I’ve never used before. The first time I shared it with my players, I’d even forgotten to implement a non-ephemeral backend to persist their character data. *Woops.*
Despite the help of AI tools and my current technical skillset, as I try to scale these experiments to greater complexity or share them with friends, peers, or family, it’s… more complex. More difficult. More painful.
These little experiments are far from impressive, or even technically competent. I’m not a developer, and I do not have a deep technical understanding of software development; I’m not trying to sell you a subscription to the *Goblin Matcher 5000 Dating App* to race to $100M ARR in gold pieces (or am I???).
Yet, I still feel that these tools are still helping me make useful software for myself, which I actually use. Furthermore, as I run into these speedbumps more and more, I find that I’m learning and growing in areas where it didn’t seem possible, before. *Does that sound familiar?*
There’s a lot that I’m concerned, frustrated, and outright angry about when it comes to AI. The technology and market seem concerning and bleak. Vendors push an increasingly aggressive message about AI replacing humans, exaggerate the readiness and capabilities of models and tools, and ignore concerns and complaints from both regulatory bodies and consumers. There is this overarching theme of fatigue (or even burnout) that I notice among Power BI, data, and tech professionals, broadly.
*There are many reasons for this; AI is just one.*

However, in the last eight months, it is starting to become more clear that:
- *Artificial general intelligence (AGI) won’t materialize from next-token predictors.*
- *AI is not on the verge of mass-replacing white-collar workers, that we can tell.*
- *AI is not a solution for every problem, and suffers from the same adoption issues as any tool.*
Don’t get me wrong; this technology is disruptive, and causing dramatic change at seemingly unprecedented volumes and rates. That said… there’s a silver lining narrative starting to emerge: success with AI seems to be increasingly about finding the right points and methods to integrate human input and context into a workflow with AI tools and AI agents.
Success with AI seem to be more about *augmenting* and *enabling* human users, rather than *replacing* them.
As the smoke starts to settle, I’m starting to see and hope for a more optimistic path forward. One where AI tools can increasingly enable people to do more and express themselves in new ways that they couldn’t, before. **There’s a pride there, a sense of creation and exploration that these tools enable which feels—ironically—incredibly human.**
*(Yes, I used the em-dashes there on purpose. Come at me, I’m not gonna stop using them.)*
---
# “IT DELETED OUR PRODUCTION DATABASE”
**AI tools have clear caveats and risks. Agents are dangerous.** You shouldn’t just “go YOLO mode” in an enterprise, unless you really want to witness an agent “yeet” important files and data into the void. If you do, make sure you record it, at least.
But seriously… the enablement that AI tools can bring is proportionate to the risk. When people try to scale and distribute a “vibe-coded” app or site or use AI-generated code that they don’t understand in an enterprise setting, they can run aground with some very serious issues. Even smaller, personal projects can have consequences as people use agentic tools, including [security breaches](https://x.com/0xzak/status/1955655184522371361), [loss of data](https://x.com/jasonlk/status/1946069562723897802) or [system access](https://github.com/anthropics/claude-code/issues/168).
**However, I don’t think that is necessarily a valid argument against using these tools.** Instead, it makes sense to consider what could facilitate more accountability and guardrails, and how people can better identify and understand these risks as they use these new tools. I think one way that we can do that is to learn from the past.
---
# “THE MORE THINGS CHANGE, THE MORE THEY STAY THE SAME”
**I get a feeling that the rise of AI-assisted coding tools draws some poignant parallels with the rise of low-code/no-code tools, like self-service BI tools such as Tableau and Power BI.** I also think that these parallels offer a lot of lessons that we might learn from the past when it comes to effective use and adoption of AI in an organization:
- Put people and business problems first over tools and technology.
- Do this by growing a culture and improving process maturity.
- Make improvements incrementally and consistently.
- Think about user enablement and risk mitigation over restriction and resistance.
- Don’t underestimate the effort of managing change and driving adoption.
- Value quality and sustainability.
- Don’t just release shit, but nurture it throughout it’s lifecycle.
- Just because something works doesn’t mean people will use it… or get use *from* it.
**I believe that the organizations and teams who understand and focus on these things today will be the ones who can get the most value from AI, tomorrow.** I also believe that the people who have focused on soft skills and understanding business problems are at a tremendous advantage. To be clear, I’m not saying that “technical skills” have any *less* value… but I am saying that soft skills will become *more* valuable with AI.

Things are changing fast; I would love to get more specific… and I will. Just not here. Not now.

---
# “BUT THIS TIME, IT’S DIFFERENT”
Despite the parallels that I might experience or speculate about, subjectively, I don’t mean to over-compare the current state of AI tools to low-code/no-code tools. LLM technology is nascent, developing at an unprecedented pace, with unprecedented investment and evangelical enthusiasm that rivals that of organized religion. AI utopians seem immune or deaf to critique, since “it will work, eventually” seems like trump card for every petulant podcasting AI evangelist.
There are also unique concerns and challenges in this technology that organizations haven’t faced before, like:
- Outputs of LLMs are non-deterministic by default, meaning that the same inputs and context might produce different outputs.
- Prompting is a contradiction where users are told to “ask any question” or “make any request” in natural language, yet simultaneously told that prompting is a skill and prompts need to be in English and specific in their content and structure.
- Engagement with chatbots is a pseudo-social experience where users are susceptible to logical fallacies that typically only arise in social settings, and not technology. Examples include challenges like attractor basins (where models tend to gravitate toward prevalent patterns in their training data, causing both user and chatbot to unknowingly fall toward them) and hermeneutic circles (where a user and chatbot engage in circular reasoning that unwittingly reinforces earlier concepts and beliefs).
Among many others.
Beyond the enterprise, it’s also clear that AI tools can and are having profound effects on us at systemic and sociological levels that we aren’t sufficiently anticipating or prepared for. Ethically, it’s a problematic technology, altogether. But I’ll step off the soapbox, because you’re not here to prepare for midnight *(unless you are? In which case, congrats on finding it).*
---
# “YOU CAN JUST MAKE THINGS”
**The current state of discourse about AI feels exhausting and unhelpful.** There seems to be this perpetual tug-of-war to control the narrative. On one side*, a vocal minority exaggerate the claims and capabilities of AI, neglect criticism, and perpetuate false narratives driven from financial interest. On the other side, a different vocal minority attack AI in any form, refusing to acknowledge possible benefits or application. The vast majority of people in the middle maybe use ChatGPT a bit, but otherwise, they just don’t know or care about AI much, at all.
**I am excluding vendors in this, who obviously have more resources, power, and control of the narrative.*
I think that everyone should experiment with AI a little more. Understand what’s possible, and what isn’t. Be critical. Be skeptical. Don’t just share the sparkly things that worked but also share the ugly things that didn’t.
Try to make something; try to build something… see how far you get. I’m not just referring to Power BI, Fabric, or data and analytics in general, either. I think you’ll be surprised.
But at the same time… don’t feel that you have to. There’s no rush; you’re not “behind the curve”. These tools are only getting easier to pick up and use. If you’ve been focused on people, processes, and problems… then you’re going to build some pretty cool things. Maybe not today. Maybe not tomorrow. But someday soon.
*I hope it feels amazing when you make it.*

---
## IN SUMMARY
**I choose to believe the real value of these new AI tools are in empowering people to overcome technical barriers and create useful things or express themselves in new ways.** For personal and narrowly-scoped scenarios, it feels like a true force multiplier. I’m sure that Copilot can and will eventually also help people to do this with Power BI, too… eventually.
However, there is no such thing as magic… or a free meal. You can make a proof-of-concept or a fancy demo quickly, sure… but a product, a solution… something reliable? That takes more than vibes, alone. As you want to scale to broader scenarios, higher complexity and more users, then technical debts must be paid in full. Your time, your money… blood, sweat, and tears.
*Communication is the new code.* And yet, you need to understand the code to truly know whether what you are saying is being heard, at all.
---
 **To me, the magic of tools like Power BI and Tableau was how quickly you could create something impressive.** Power BI used to encapsulate this perfectly with their [***five-by-five***](https://www.madrona.com/james-phillips-mark-nelson-produce-led-growth-and-scaling/): *5 seconds to sign up, and 5 minutes to wow!* In five minutes, a businessperson from a non-technical background and some average data/computer literacy could do things in Power BI that really made them say… *wow!*
*Honestly, I don’t know why Microsoft ever stopped using that phrase…*
Anyway, my business intelligence journey didn’t actually start with Power BI. Or Microsoft. It started with Tableau. I’d heard about Tableau from a guy at the gym, who told me his colleague used it in their work, as a data visualization consultant:
“Wait a minute,” I said upon hearing his explanation, “You’re telling me there’s a *job* where you’re *paid* to *make graphs* and *analyze data?*” It sounded like a dream come true, “I just have to learn this Tableau thing?”
So, completely oblivious to business intelligence altogether, I started a trial in Tableau. Back then I worked in scientific research, so I just took it for a spin on some of my own research project data. I still remember the first charts I made in Tableau.
 At this stage in my career:
- I had limited to no programming knowledge, whatsoever (I didn’t even know what SQL *was*, nevermind how to write it).
- I had no technical know-how about databases, data formats, or transformation (I once misunderstood “JSON data” as literally “Jason’s data”. I also had never even heard of or done a VLOOKUP, before).
- I had no knowledge at all about data visualization best practices; just an overall interest and gut feeling for design (the only other data visualization tool I used was GraphPad Prism and Google Sheets… that’s right… I didn’t even use Excel).

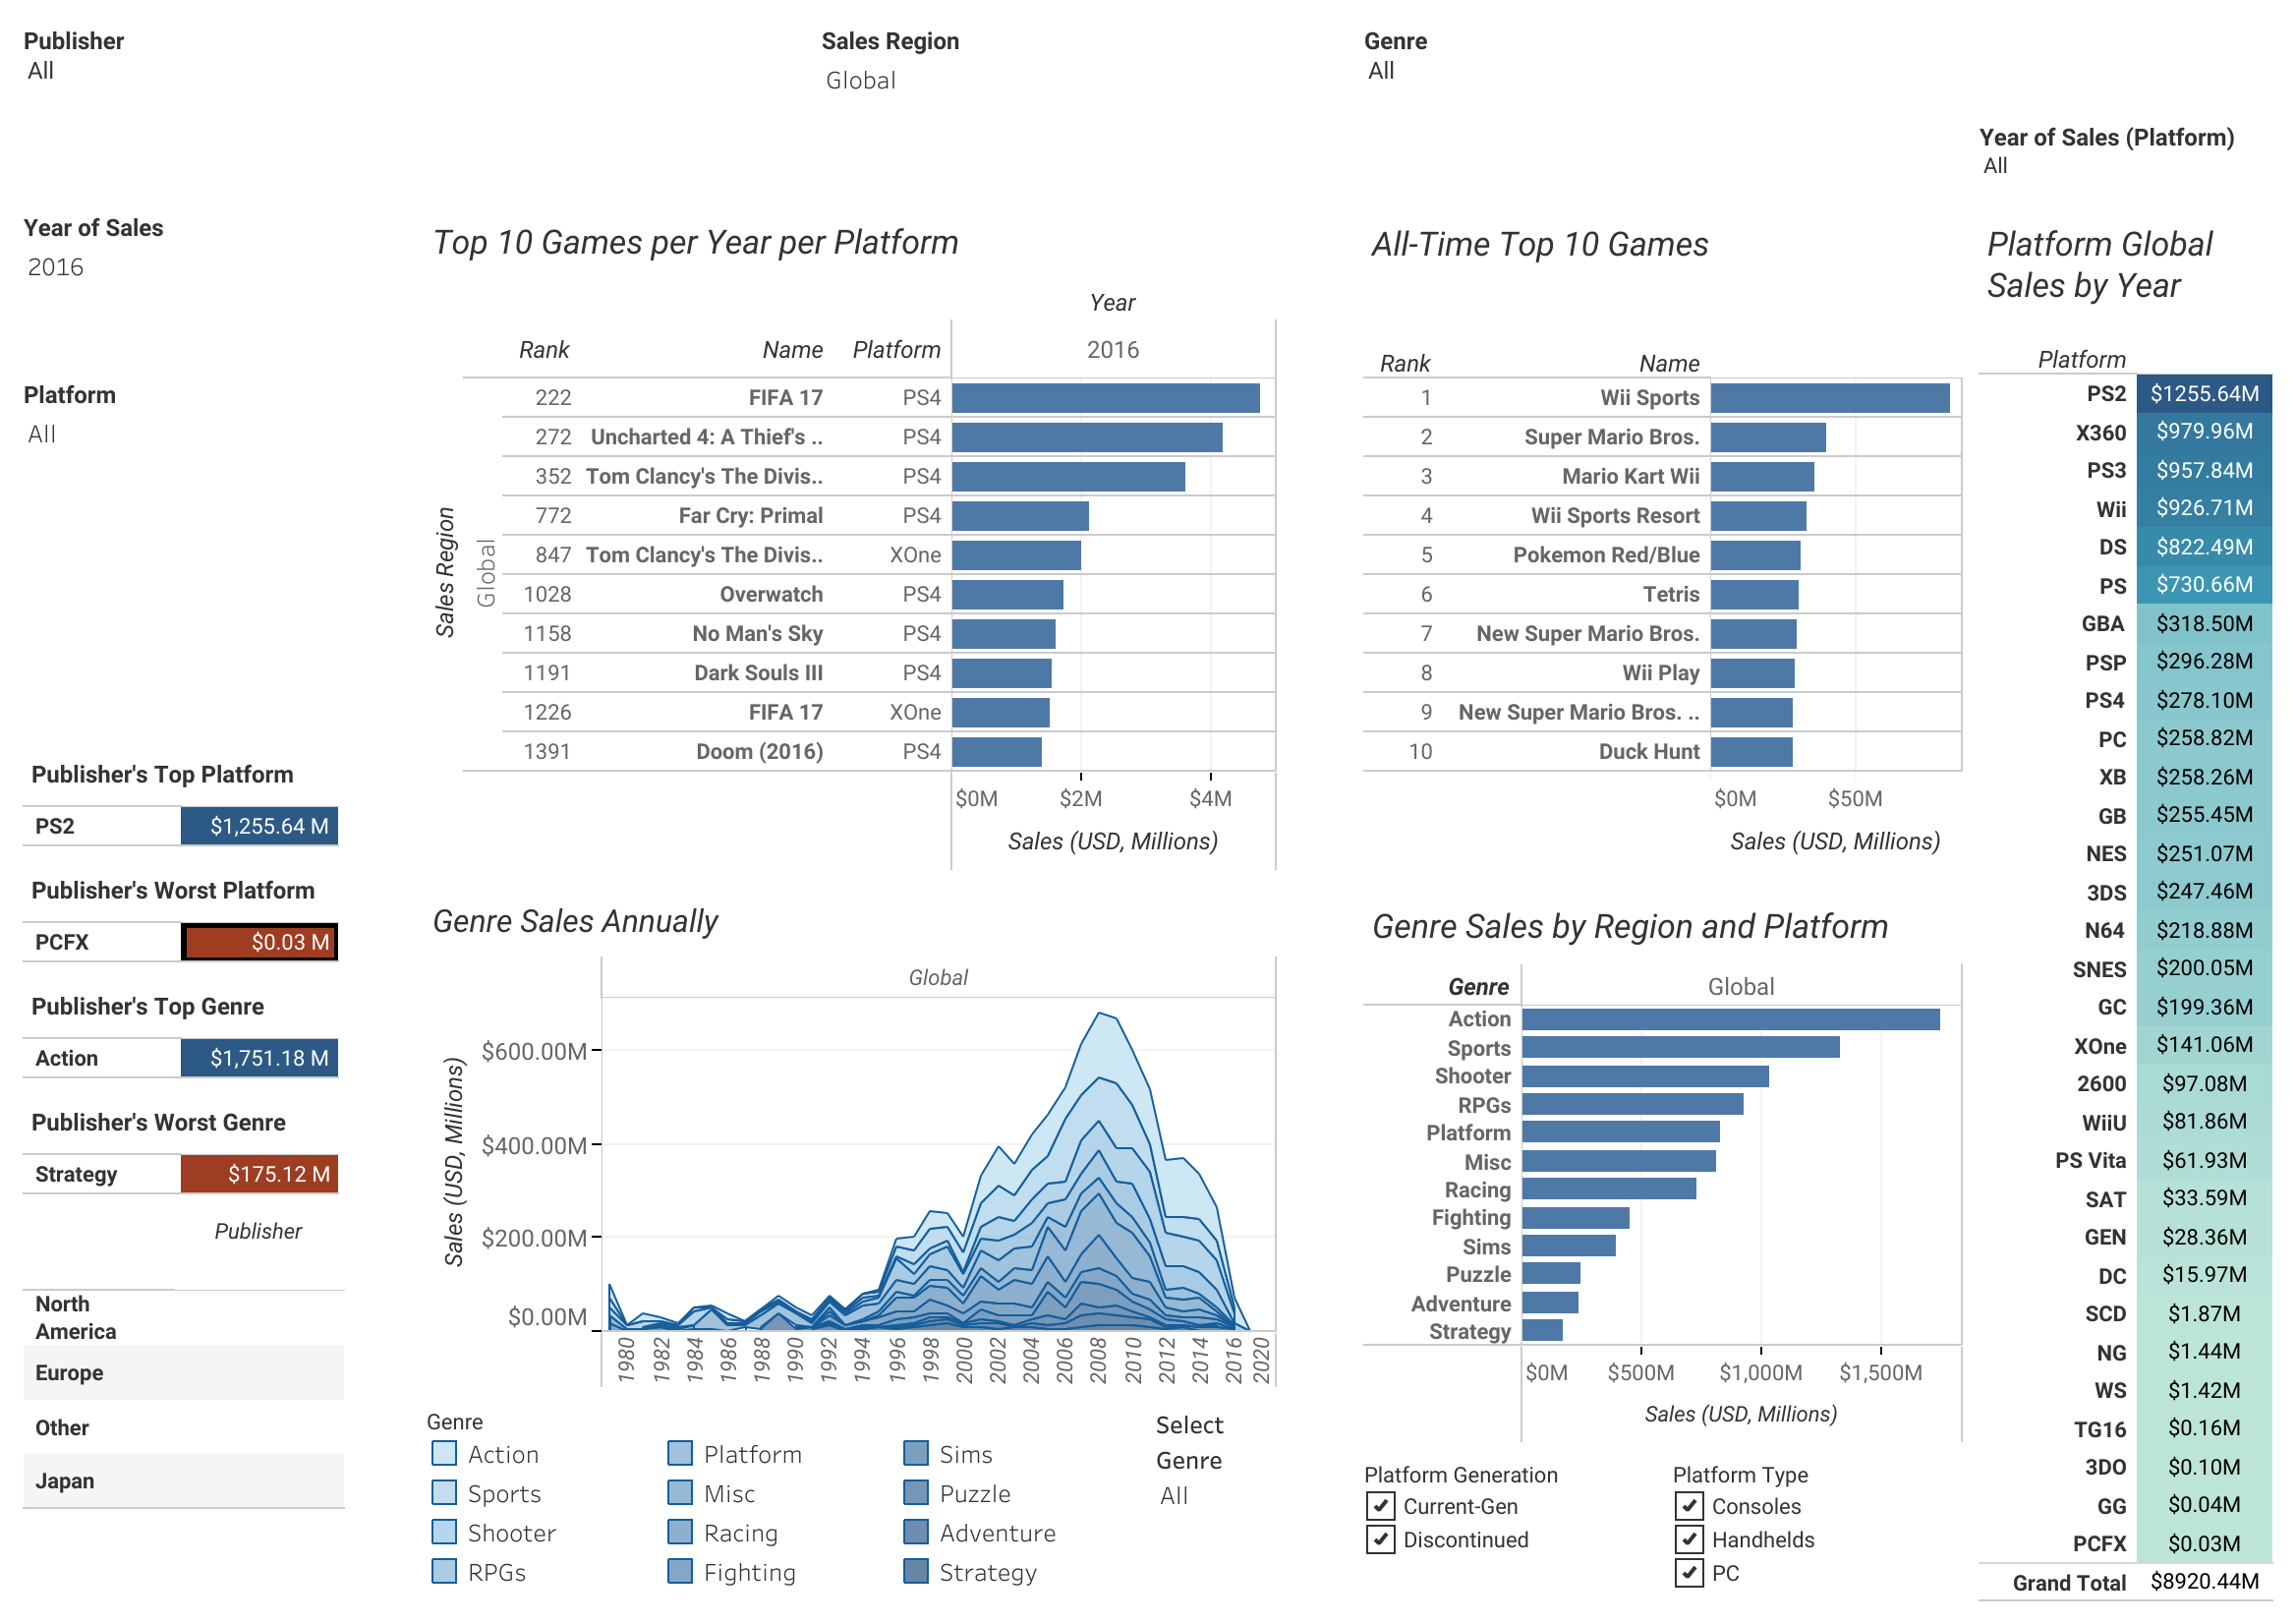 
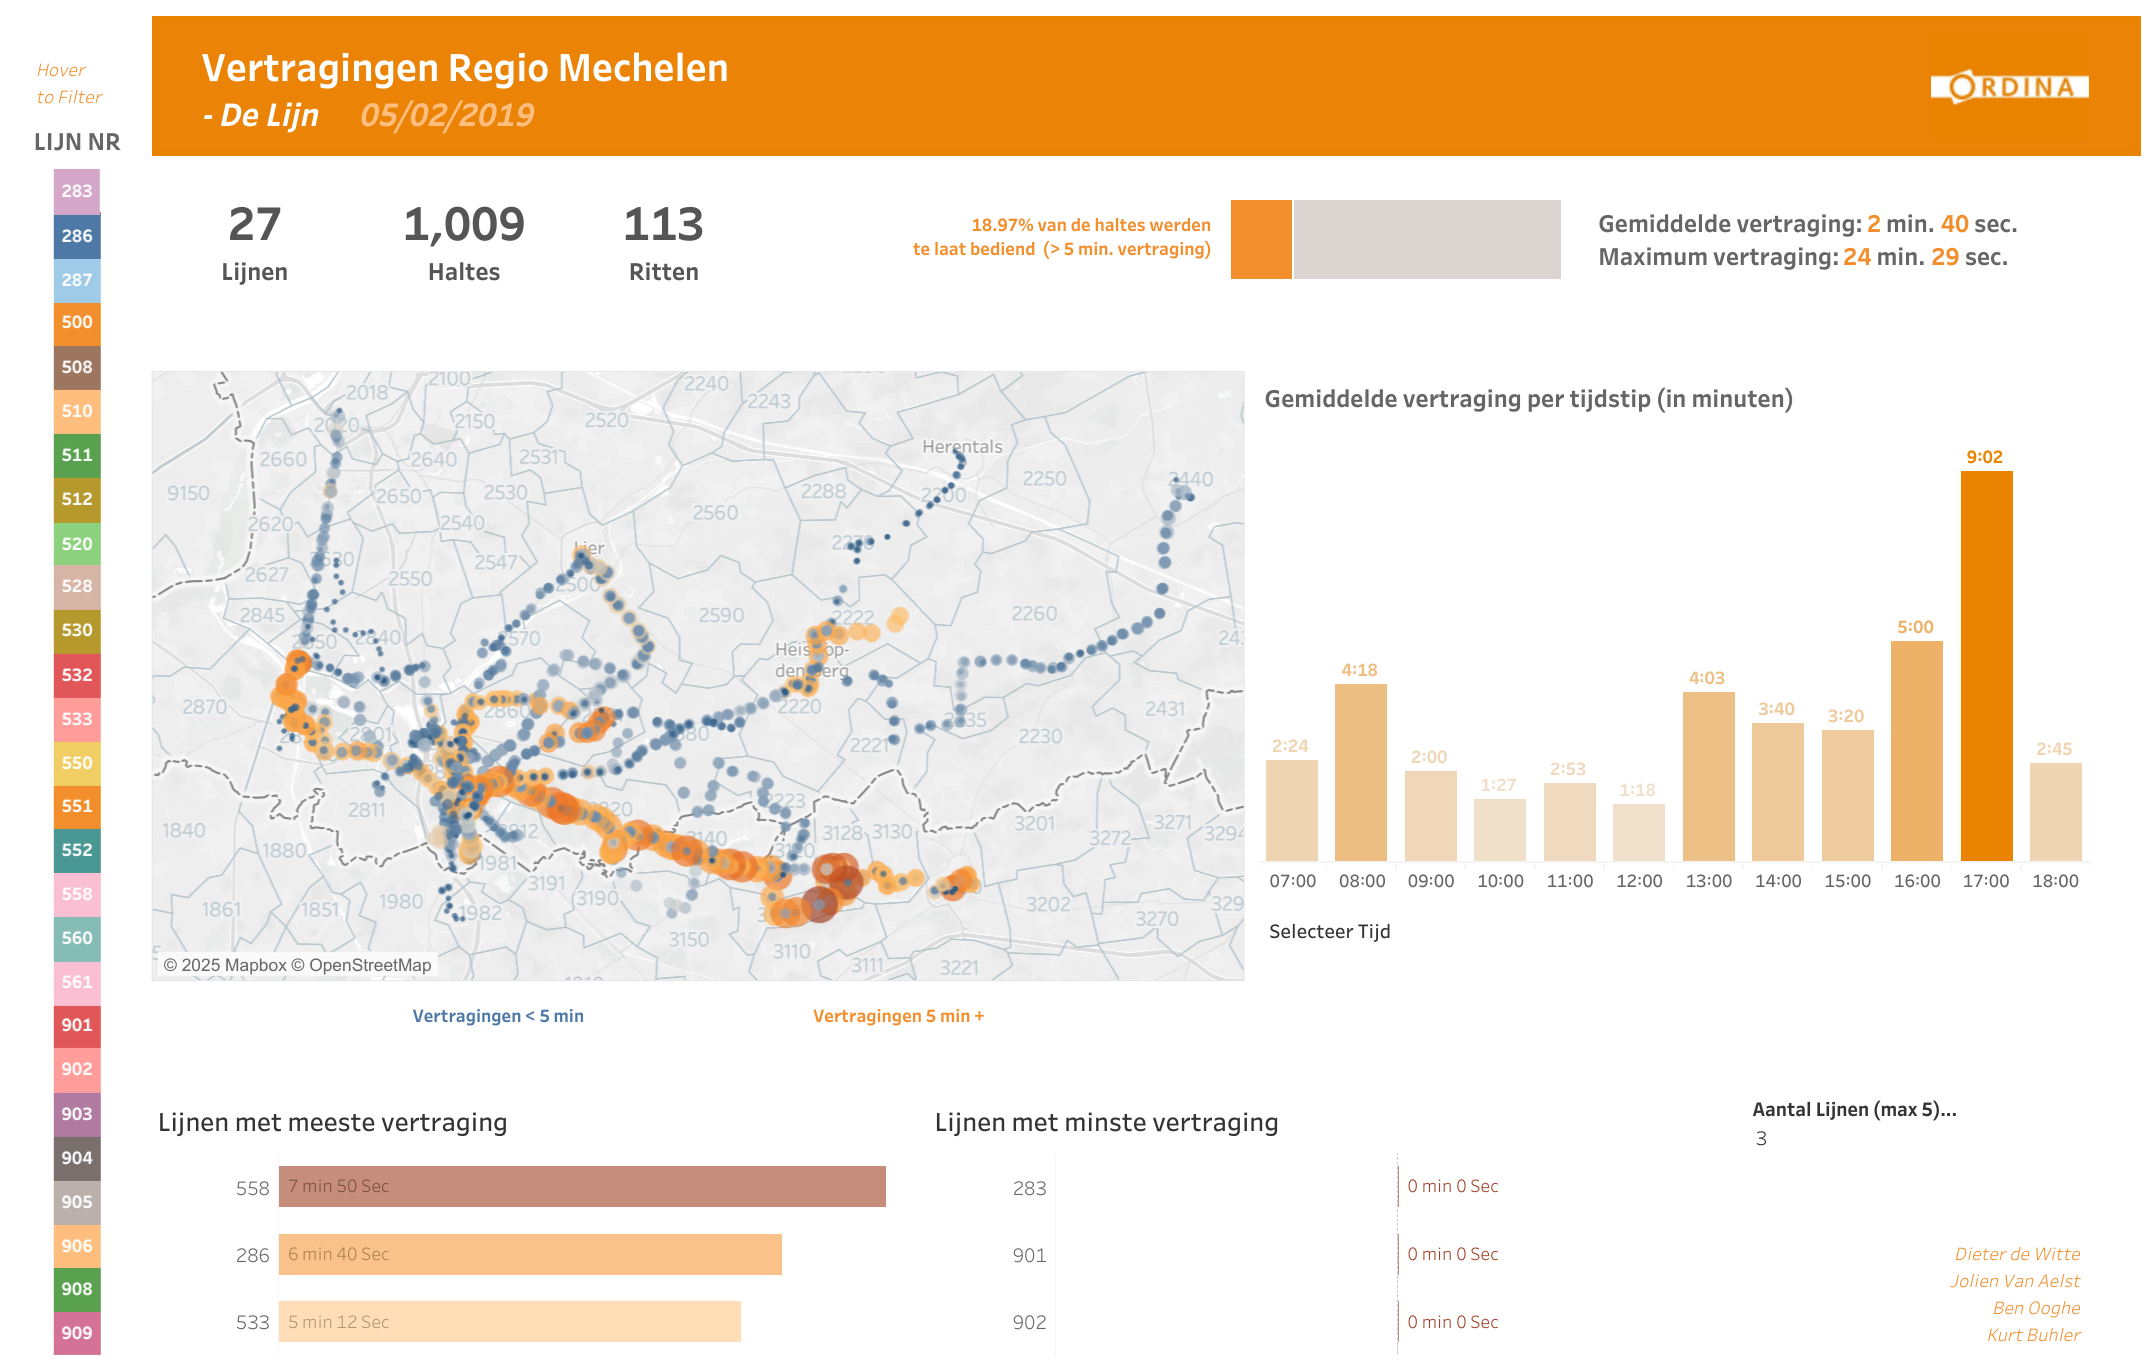 Lightning in a bottle.
**Lightning struck twice.** Fast-forward about a year later, and I was working as a data visualization consultant. Except, I wasn’t working with Tableau… there were no Tableau projects for juniors for me, at the time. So, I was on the bench, learning Power BI.
I remember vividly my first experiences with Power BI:
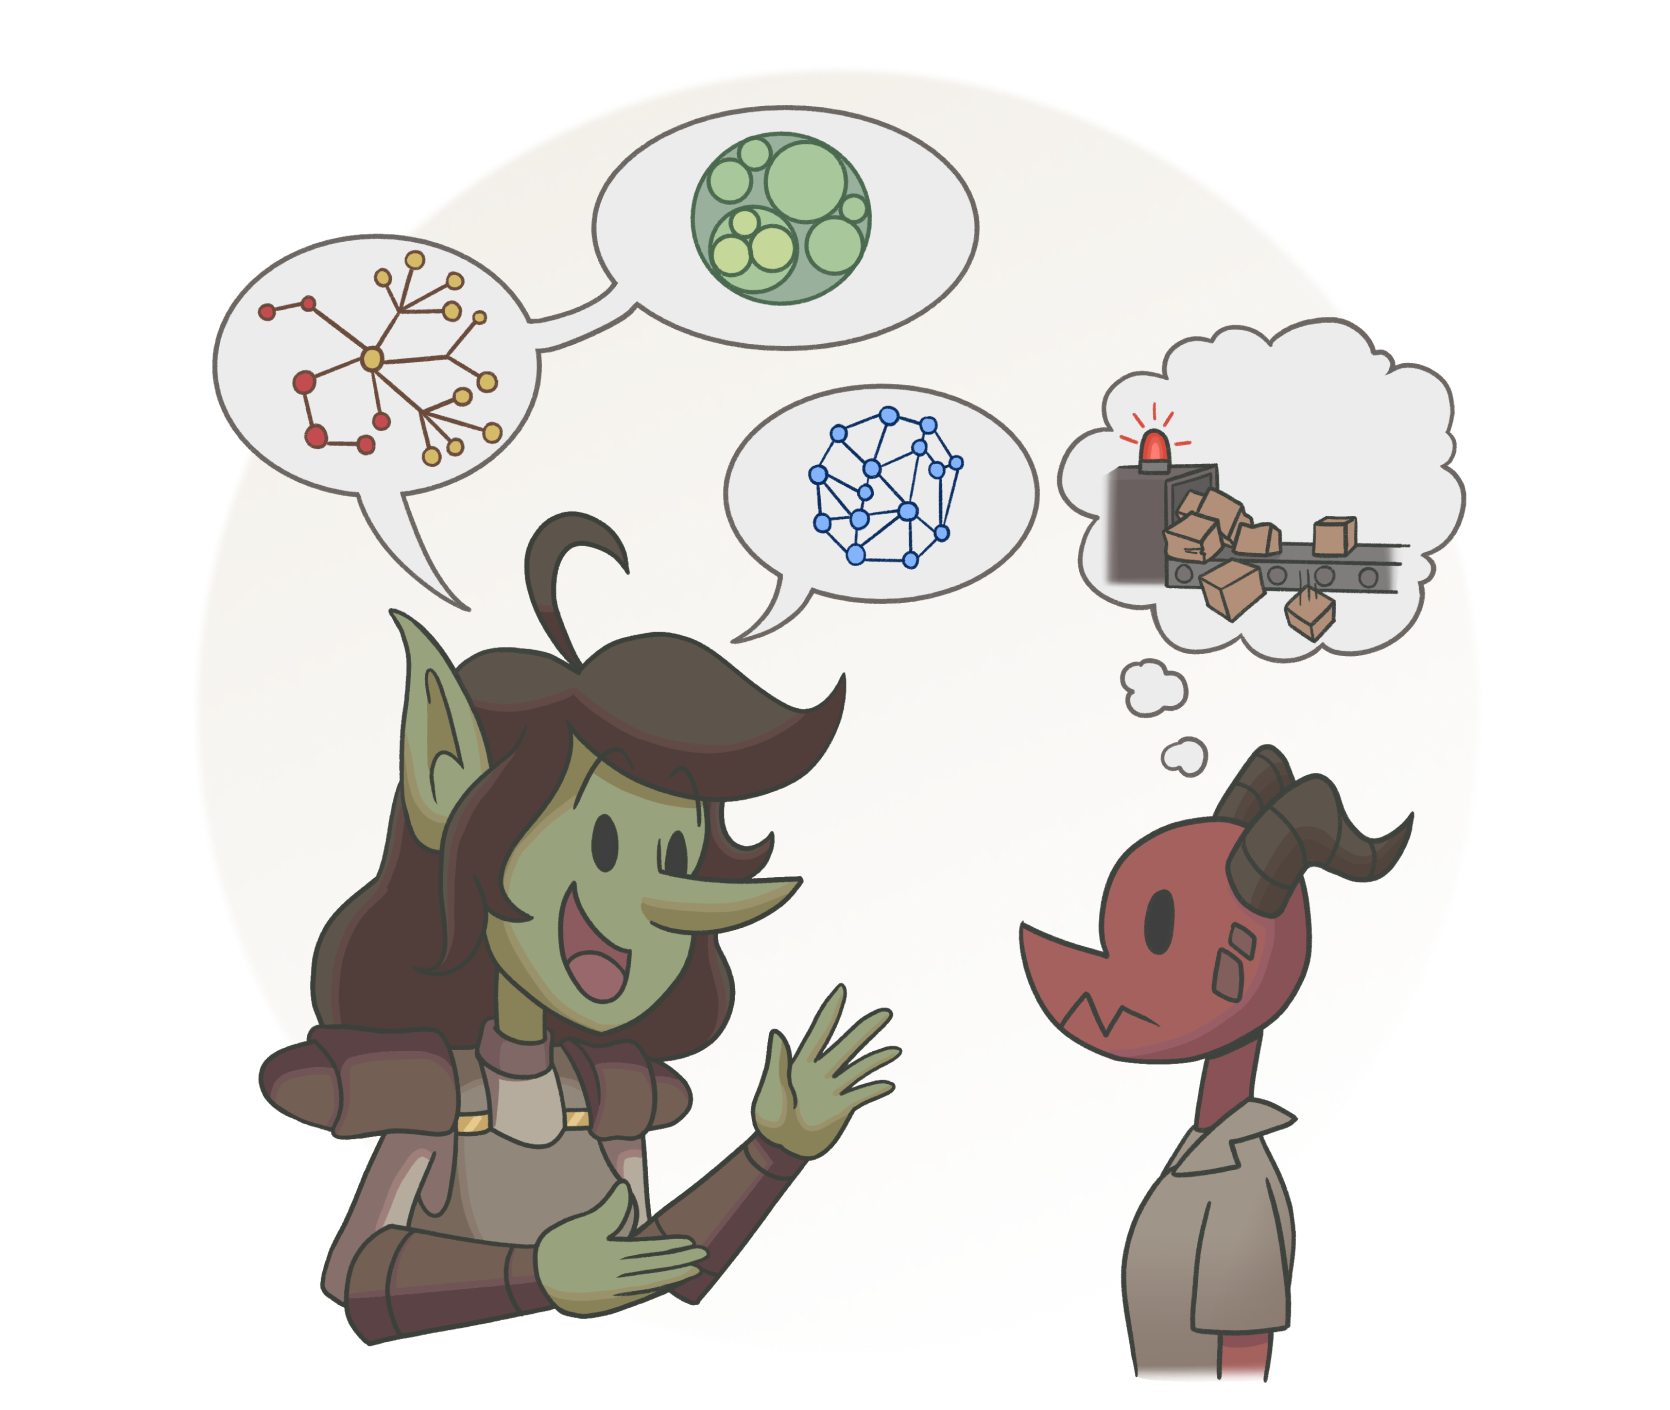
I remember the first time I saw a semantic model. A bunch of grey boxes connected by lines and arrows.
*“What the fuck is this,”* I literally said out loud.
 ---
# “YOU CAN’T JUST PUT THIS INTO PRODUCTION”
Low-code and no-code tools like Power BI and Tableau *felt* like magic, because suddenly, users could bypass technical barriers and make useful things quite quickly. However, as we all know… there’s no such thing as magic. It’s one thing to make a Tableau or Power BI dashboard for a demo, a proof-of-concept, or an analysis of a few worksheets from Excel. It’s another thing to make a dashboard from organizational data for daily use by a team or department.
 Just because the technical bits are skipped doesn’t mean that they don’t exist. You can lower technical barriers for people to build things, but the barriers to reach a mature, sustainable, and secure data product are higher, and drop at a significantly lower rate. Neglecting that creates technical debt, which can be… painful.
As tools like Power BI and Tableau grew in popularity, it became commonplace to hear growing pain stories. People struggled with performance, DAX, reporting requirements, and a great deal of many other things.
It also became commonplace to hear how Tableau and Power BI became an epicenter for conflict between central IT teams and decentralized or self-service business teams:
**IT was often blindsided by this bottom-up adoption of a reporting tool**, with new dashboards that created business process dependencies or absorbed both technical and FTE resources. There also often came demand from key users and executives, who—impressed by the dashboards shown or emailed to them—wanted to scale and expand their use. Unheard concerns about governance, security, and sustainability often boiled into frustration. Dashboard creators were often decried as naïve and ignorant about the resources needed to turn their grassroots personal project into a sustainable enterprise reporting solution.
**Business often didn’t understand the (usually valid) concerns from IT, which they saw as resistance** and pushback preventing them from moving faster and getting what they wanted. Sometimes, if IT locked the door, then business would break a window. Shadow IT became all too commonplace, as some teams sought to circumvent IT altogether. They hired their own technical consultants and set up their own technical resources with copies of data, which often only compounded risk and cost.
Even beyond this conflict, Power BI implementations often clipped the curb. Organizations struggled with many challenges, like missing features (even if they existed in Analysis Services), an inflexible and inefficient report creation experience (which is still the case, if I’m honest) and support for enterprise scenarios. Adoption struggles became a common issue as many teams realized the bottleneck to a successful use of Power BI was more about user enablement and data culture than it was about technical features and practices. Conversations among report creators were often less about certain features and more “how can I get my users to stop exporting to Excel / using the old Excel reports?”
 A common story was a reporting project that started off simple and useful. However, eventually, cumulating complexity or size snowballed over time. Simple, finely-scoped models became bloated monsters with query and refresh performance issues, a maze of dependant objects, and no documentation. Reports became clunky and inflexible, as the creators struggled to find ways to show the data they wanted to. It wasn’t uncommon to hear about report creators defeated by the “export to Excel” button or becoming disillusioned and switching to another reporting tool.
There was a pattern that emerged: it was quick and easy to make small dashboards with simple scenarios. Consultants will often tell you they can make reports in days… or even hours. However, scaling these things to more data, users, and business areas is… more complex. More difficult. More painful. For a lot of Power BI users—me included—discovering these technical teeth and barbs hidden beneath the surface was not very… *wow*.
**In short, the promises and short-lived euphoria of these low-code/no-code tools often ran aground when they needed to scale.** When confronted with real deployment, enterprise scenarios, and security risks, self-service teams lacked the maturity and technical experience to navigate this successfully.
So, they learned. Some slower and more painfully than others… but *we* *all learned*.
 This collision didn’t doom these tools, of course. Rather, confrontation with reality and scale forced the tools and their users to grow. Power BI users from a non-technical background have undoubtedly grown their technical knowledge *because of *Power BI. Furthermore, Power BI as it exists today—while not without its flaws—is definitely a more robust, sophisticated tool that can support enterprise reporting scenarios, and much more.
Now—a few years later—we’re experiencing another wave of new tools and technology driven by the tsunami that is AI. Agentic coding tools like [Cursor](https://cursor.com/agents), [v0](https://v0.app/), [Replit](https://replit.com/), [Claude Code](https://www.anthropic.com/claude-code) and others are enabling a wave of non-technical creators to build with code by prompting AI. This is commonly referred to as “[vibe coding](https://x.com/karpathy/status/1886192184808149383?lang=en)”; focusing on the desired outcome and using natural language engagement with AI, rather than the code itself.

*Vibe coding* has emerged as somewhat of a cultural phenomenon for many. It’s also got a *particularly* toxic discourse, among which are some promising signs of something special happening, albeit accompanied by some *very* valid concerns and serious caveats.
For the last year, I’ve been wading ever deeper into the murky, frothing, rising sea that is AI. From Copilot in Power BI to command-line tools and asynchronous agents, I’ve been exploring, researching, and testing these things to better understand how they work and when or why they are useful for me (if at all). Not just in Power BI and Fabric, but in general. I haven’t really shared that much about this, yet.
---
# “HEY CLAUDE, LET’S CONTINUE ON THIS…”

**A few months ago, I used AI to help me make a web application for the first time.** It helps manage the custom rules and setting of our D&D game. Something small… personal use. Within some hours, I had something functional and reliable for our needs that replaced a dozen publish-to-web Power BI reports (which I regularly use in demos), scattered Google Docs documents and a few webpages. Seeing and click through the working application for the first time, it immediately threw me back to my first Tableau visuals.
Lightning, again.
A year ago, the idea of coding and deploying full-stack software for my own use would have been unthinkable. Now, it seems like a weekly activity; so much more seems possible than ever before. The passionate enthusiasm I first felt with Tableau and Power BI has resurfaced in the form of Claude Code, Gemini CLI, and others.* Five seconds to sign up… five minutes to wow.*
**Again, it *felt* like magic… but magic doesn’t exist. Software doesn’t run on *feelings*.**
I’ve spent many hours debugging random AI-generated mistakes in code, backtracking on design mistakes from earlier sessions I wasn’t even aware I made, or trying to fumble my way through deployment with services, languages, and frameworks that I’ve never used before. The first time I shared it with my players, I’d even forgotten to implement a non-ephemeral backend to persist their character data. *Woops.*
Despite the help of AI tools and my current technical skillset, as I try to scale these experiments to greater complexity or share them with friends, peers, or family, it’s… more complex. More difficult. More painful.
These little experiments are far from impressive, or even technically competent. I’m not a developer, and I do not have a deep technical understanding of software development; I’m not trying to sell you a subscription to the *Goblin Matcher 5000 Dating App* to race to $100M ARR in gold pieces (or am I???).
Yet, I still feel that these tools are still helping me make useful software for myself, which I actually use. Furthermore, as I run into these speedbumps more and more, I find that I’m learning and growing in areas where it didn’t seem possible, before. *Does that sound familiar?*
There’s a lot that I’m concerned, frustrated, and outright angry about when it comes to AI. The technology and market seem concerning and bleak. Vendors push an increasingly aggressive message about AI replacing humans, exaggerate the readiness and capabilities of models and tools, and ignore concerns and complaints from both regulatory bodies and consumers. There is this overarching theme of fatigue (or even burnout) that I notice among Power BI, data, and tech professionals, broadly.
*There are many reasons for this; AI is just one.*

However, in the last eight months, it is starting to become more clear that:
- *Artificial general intelligence (AGI) won’t materialize from next-token predictors.*
- *AI is not on the verge of mass-replacing white-collar workers, that we can tell.*
- *AI is not a solution for every problem, and suffers from the same adoption issues as any tool.*
Don’t get me wrong; this technology is disruptive, and causing dramatic change at seemingly unprecedented volumes and rates. That said… there’s a silver lining narrative starting to emerge: success with AI seems to be increasingly about finding the right points and methods to integrate human input and context into a workflow with AI tools and AI agents.
Success with AI seem to be more about *augmenting* and *enabling* human users, rather than *replacing* them.
 As the smoke starts to settle, I’m starting to see and hope for a more optimistic path forward. One where AI tools can increasingly enable people to do more and express themselves in new ways that they couldn’t, before. **There’s a pride there, a sense of creation and exploration that these tools enable which feels—ironically—incredibly human.**
*(Yes, I used the em-dashes there on purpose. Come at me, I’m not gonna stop using them.)*
---
# “IT DELETED OUR PRODUCTION DATABASE”
 **AI tools have clear caveats and risks. Agents are dangerous.** You shouldn’t just “go YOLO mode” in an enterprise, unless you really want to witness an agent “yeet” important files and data into the void. If you do, make sure you record it, at least.
But seriously… the enablement that AI tools can bring is proportionate to the risk. When people try to scale and distribute a “vibe-coded” app or site or use AI-generated code that they don’t understand in an enterprise setting, they can run aground with some very serious issues. Even smaller, personal projects can have consequences as people use agentic tools, including [security breaches](https://x.com/0xzak/status/1955655184522371361), [loss of data](https://x.com/jasonlk/status/1946069562723897802) or [system access](https://github.com/anthropics/claude-code/issues/168).
**However, I don’t think that is necessarily a valid argument against using these tools.** Instead, it makes sense to consider what could facilitate more accountability and guardrails, and how people can better identify and understand these risks as they use these new tools. I think one way that we can do that is to learn from the past.
---
# “THE MORE THINGS CHANGE, THE MORE THEY STAY THE SAME”
**I get a feeling that the rise of AI-assisted coding tools draws some poignant parallels with the rise of low-code/no-code tools, like self-service BI tools such as Tableau and Power BI.** I also think that these parallels offer a lot of lessons that we might learn from the past when it comes to effective use and adoption of AI in an organization:
- Put people and business problems first over tools and technology.
- Do this by growing a culture and improving process maturity.
- Make improvements incrementally and consistently.
- Think about user enablement and risk mitigation over restriction and resistance.
- Don’t underestimate the effort of managing change and driving adoption.
- Value quality and sustainability.
- Don’t just release shit, but nurture it throughout it’s lifecycle.
- Just because something works doesn’t mean people will use it… or get use *from* it.
**I believe that the organizations and teams who understand and focus on these things today will be the ones who can get the most value from AI, tomorrow.** I also believe that the people who have focused on soft skills and understanding business problems are at a tremendous advantage. To be clear, I’m not saying that “technical skills” have any *less* value… but I am saying that soft skills will become *more* valuable with AI.

Things are changing fast; I would love to get more specific… and I will. Just not here. Not now.

---
# “BUT THIS TIME, IT’S DIFFERENT”
Despite the parallels that I might experience or speculate about, subjectively, I don’t mean to over-compare the current state of AI tools to low-code/no-code tools. LLM technology is nascent, developing at an unprecedented pace, with unprecedented investment and evangelical enthusiasm that rivals that of organized religion. AI utopians seem immune or deaf to critique, since “it will work, eventually” seems like trump card for every petulant podcasting AI evangelist.
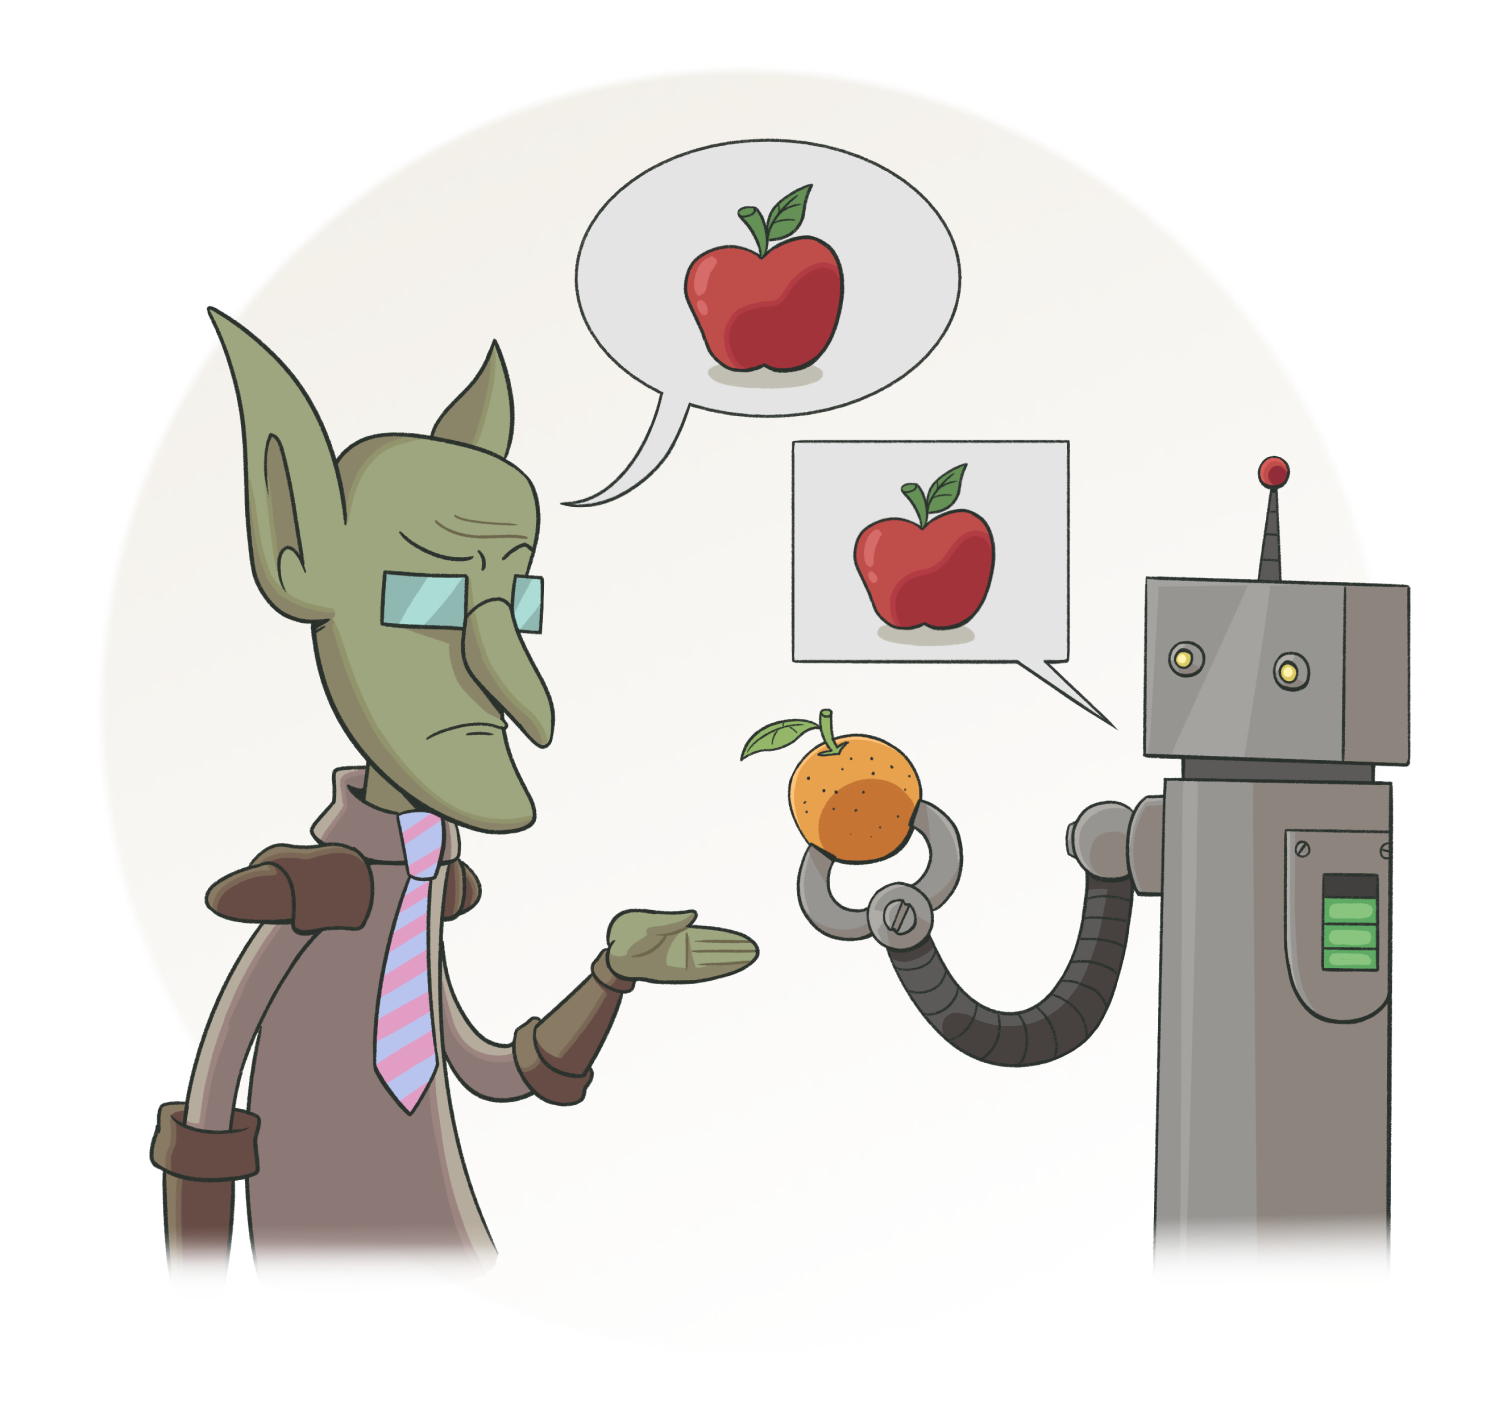 There are also unique concerns and challenges in this technology that organizations haven’t faced before, like:
- Outputs of LLMs are non-deterministic by default, meaning that the same inputs and context might produce different outputs.
- Prompting is a contradiction where users are told to “ask any question” or “make any request” in natural language, yet simultaneously told that prompting is a skill and prompts need to be in English and specific in their content and structure.
- Engagement with chatbots is a pseudo-social experience where users are susceptible to logical fallacies that typically only arise in social settings, and not technology. Examples include challenges like attractor basins (where models tend to gravitate toward prevalent patterns in their training data, causing both user and chatbot to unknowingly fall toward them) and hermeneutic circles (where a user and chatbot engage in circular reasoning that unwittingly reinforces earlier concepts and beliefs).
Among many others.
Beyond the enterprise, it’s also clear that AI tools can and are having profound effects on us at systemic and sociological levels that we aren’t sufficiently anticipating or prepared for. Ethically, it’s a problematic technology, altogether. But I’ll step off the soapbox, because you’re not here to prepare for midnight *(unless you are? In which case, congrats on finding it).*
 ---
# “YOU CAN JUST MAKE THINGS”
**The current state of discourse about AI feels exhausting and unhelpful.** There seems to be this perpetual tug-of-war to control the narrative. On one side*, a vocal minority exaggerate the claims and capabilities of AI, neglect criticism, and perpetuate false narratives driven from financial interest. On the other side, a different vocal minority attack AI in any form, refusing to acknowledge possible benefits or application. The vast majority of people in the middle maybe use ChatGPT a bit, but otherwise, they just don’t know or care about AI much, at all.
**I am excluding vendors in this, who obviously have more resources, power, and control of the narrative.*
I think that everyone should experiment with AI a little more. Understand what’s possible, and what isn’t. Be critical. Be skeptical. Don’t just share the sparkly things that worked but also share the ugly things that didn’t.
Try to make something; try to build something… see how far you get. I’m not just referring to Power BI, Fabric, or data and analytics in general, either. I think you’ll be surprised.
But at the same time… don’t feel that you have to. There’s no rush; you’re not “behind the curve”. These tools are only getting easier to pick up and use. If you’ve been focused on people, processes, and problems… then you’re going to build some pretty cool things. Maybe not today. Maybe not tomorrow. But someday soon.
*I hope it feels amazing when you make it.*

---
 ## IN SUMMARY
**I choose to believe the real value of these new AI tools are in empowering people to overcome technical barriers and create useful things or express themselves in new ways.** For personal and narrowly-scoped scenarios, it feels like a true force multiplier. I’m sure that Copilot can and will eventually also help people to do this with Power BI, too… eventually.
However, there is no such thing as magic… or a free meal. You can make a proof-of-concept or a fancy demo quickly, sure… but a product, a solution… something reliable? That takes more than vibes, alone. As you want to scale to broader scenarios, higher complexity and more users, then technical debts must be paid in full. Your time, your money… blood, sweat, and tears.
*Communication is the new code.* And yet, you need to understand the code to truly know whether what you are saying is being heard, at all.
---