# Disable Auto-scaling in Power BI Visuals
> ‘Responsive Visuals’ is a lesser-known feature that in general helps users make better graphs without fawning over visual settings & parameters. However, disabling it might be necessary at times when you are trying to achieve a specific result that Power BI default visuals won’t seem to permit.
- URL: https://data-goblins.com/disable-font-autoscaling
- Author: Kurt Buhler
- Published: 2022-07-05
- Topic: Reports and visuals
# DISABLING ‘RESPONSIVE’ IN THE VISUAL SETTINGS PANE
*Get a bit more control over **visual appearance / options** in Power BI for edge use-cases.*
---
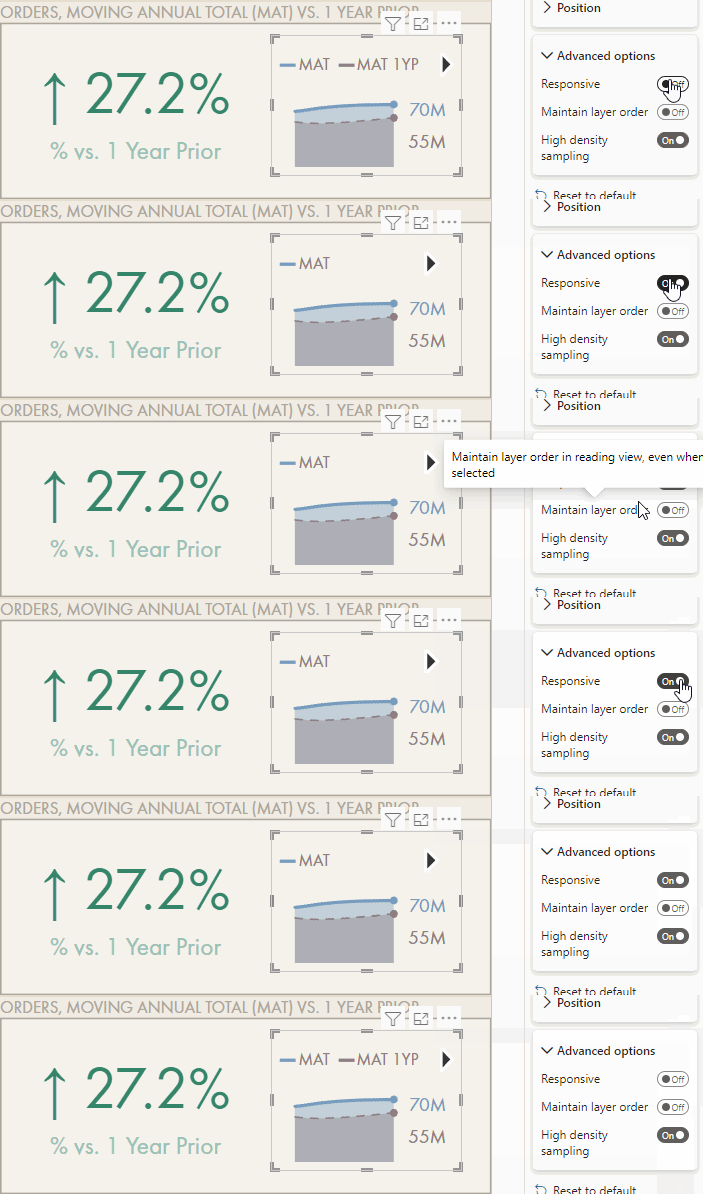
For example, disabling ‘Responsive’ may allow visuals to show text when there’s space.
---
## WHAT IS AUTO-SCALING AND WHY WOULD I DISABLE IT?
### THE ‘RESPONSIVE’ PROPERTY
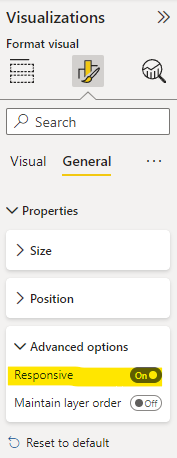
The ‘ Responsive ’ option is in the Visualizations Pane, under General > Properties > Advanced options
**To help people make good visuals, Power BI needs a smart, guided user-experience**. People looking for insights in their data turn to self-service tools like Power BI to quickly create what they need without having to tweak dozens of settings and parameters. For example, it would be exhausting for the average user if - after every time they slightly resized a chart - they had to adjust the font size of each axis, the labels, the title, and so forth. Thankfully, Power BI does this for you, thanks to the** *Responsive*** property of a visual.
This feature - Released in July 2017 - is called **Responsive Visuals**. The purpose is to** automatically adjust certain visual properties** in response to the size of the visual container (how big the chart is). It’s enabled by default on the below standard visualization types:
- *Bar Charts / Combo Charts*
- *Line Charts / Area Charts*
- *Waterfalls*
- *Scatterplots*
- *Ribbon Charts*
### WHEN IS IT ACTIVE?
When Responsive is active
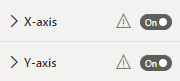
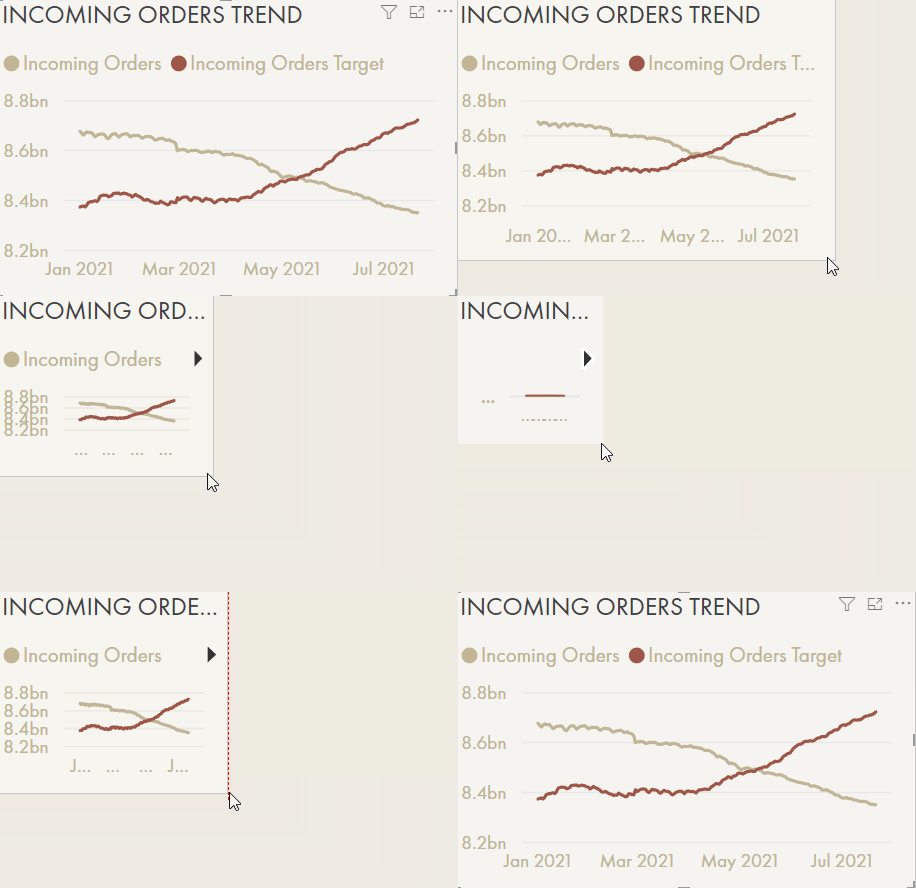
The general rule-of-thumb is that auto-scaling is active whenever the visual element cannot be fully rendered; when it can’t be seen “properly”. You get a good feel for when it’s active once you recognize it, but the UI in the Visualization Pane will also notify you with a warning label.
In general, this property is a good thing. Like an automatic transmission, it’s convenient and easy. However, there are times when you need to drive stick-shift; **cases exist where disabling ‘Responsive’ will give a bit more control over the visual customization.**
---
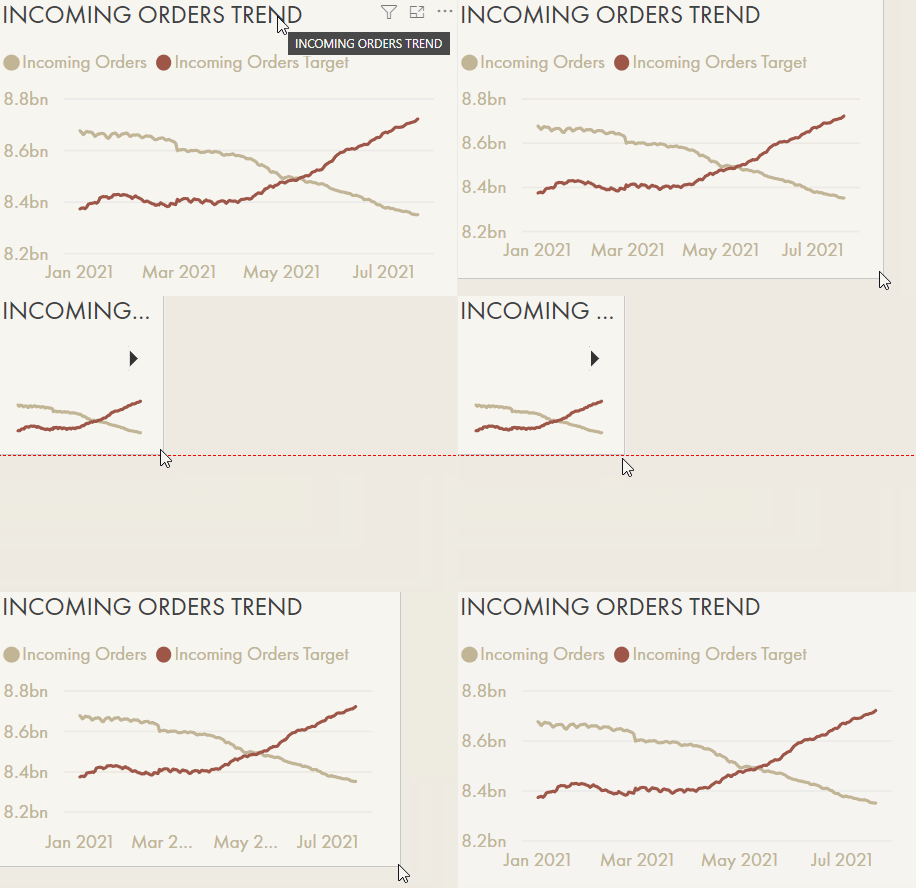
### RESPONSIVE VISUALS: EXAMPLE ON (LEFT) VS OFF (RIGHT)
Responsive enabled: Axis & gridlines get hidden & text will shrink automaticallyResponsive disabled: Chart parameters remain fixed; becomes unreadable after a certain size
---
### WHY WOULD WE DISABLE IT?
When using the default visualizations in Power BI, it can be difficult to get visuals in reports to look just the way you want them to. Any additional control helps. Disabling ‘Responsive’ works for those edge-cases, usually when the default visualizations are being macguyvered to fill a requirement they weren’t intended to.
**1. Adjust Parameters disabled by Responsive**
Responsive is a dominant property that - when active - will prevent other properties from being enabled. For example, if you want to change the range of the X-axis, but the axis is hidden due to Responsive Visuals, you won’t be able to unless you disable the property.

**2. Force display of text & labels**
There are times when Responsive is a little too conservative. For example in the below combination of visuals, Responsive tries to hide the second legend item, even though there is whitespace to render it. Disabling Responsive allows the visual to render the first two legend items as intended.
Bonus tip: Unicode characters like arrows in format strings are helpful for data labels.
**3. Other edge-cases where you need more control over fonts & display**
If you are struggling with getting out-of-the-box visuals to display as intended, especially when you get into “macguyver” territory, disabling “Responsive” is a good first step to see if you get to where you want.
---
## CONCLUSION
**‘Responsive Visuals’ is a lesser-known feature** that in general helps users make better graphs without fawning over visual settings & parameters. **However, disabling it might be necessary at times** when you are trying to achieve a specific result that Power BI default visuals won’t seem to permit.
---